EngageNY
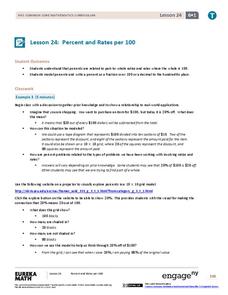
Percent and Rates per 100
What percentage of your class understands percents? Pupils learn the meaning of percents based upon rates per 100 in the 24th lesson in a series of 29. They represent percents as fractions, decimals, ratios, and models. The scholars...
EngageNY
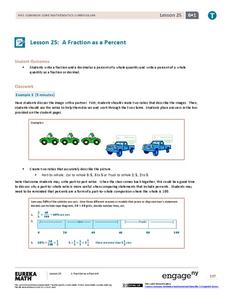
A Fraction as a Percent
It is all about being equivalent. Class members convert between fractions, decimals, and percents. By using visual models, scholars verify their conversions in the 25th portion of a 29-part series.
EngageNY
Solving Percent Problems III
What happens when combining percentage discounts? The last lesson in a series of 29 introduces the idea of combining discounts one after another. Pupils wrestle with the claim that to find the total discount, they need to only add...
Curated OER
Grid and Percent It
Students explore percent. In this percent lesson, students investigate how to represent percentages on a hundreds grid. Working independently, students solve mathematical problems involving percentages.
Curated OER
Number Line Mathematics
Students translate problem situations into diagrams, models, and numerals using whole numbers, fractions, mixed numbers, decimals, and percents. They identify that numbers in different forms are equivalent or not equivalent using whole...
Curated OER
Introducing the Concept: Percents
Students explore the math concept of percents. In this percents lesson, students examine visual examples of the relationships among fractions, decimals, and percents. Students also practice solving problems that their instructors model.
Curated OER
Ratios, Proportions and Percents
Fifth graders complete 3 activities centered around percents. In this ratios, proportions and percents lesson, 5th graders create designs on grid paper that illustrate a variety of percents, solve percent problems mentally, and use...
Curated OER
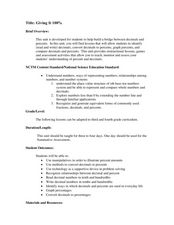
Giving it 100%
Students build knowledge about the number relationships between decimals and percents as it relates to converting decimals into percents. In this decimal and percent lesson, students recognize equivalent forms of fractions,...
Curated OER
Understanding Percent
For this understanding percent worksheet, students use a computer program to complete 8 sections, then work off the computer and answer 7 questions with fraction strips, tables and grids.
Curated OER
Relating Fractions, Decimals, and Percents
Fifth graders participate in a lesson that is concerned with the concept of telling the differences between a fraction, decimal, and percent. There is a good example of conversion in the lesson.
Curated OER
Percents
Students explore the concept of percents. In this percents lesson, students discuss the prefix cent and words that contain that prefix. Students make bead necklaces and determine the percentages of certain beads in relation to the necklace.
Curated OER
The Number Line
Eighth graders investigate the order of numbers and how they are located on the number line. They also review the symbols used to compare quantities in order to decipher simple expressions and graph them on the numberline.
Curated OER
Investigation- What Does It Cost?
Eighth graders investigate percents by comparing different discounts on the same sale item, practice graphing percents, and look at reasonable and unreasonable "percents off" a sale item.
US Department of Commerce
Diversity: Differences in Communities
Using census data, the class finds the percentages of three diversity categories for four states and compare them. With the assistance of a 10 X 10 grid, pupils create visual representations of a comparison between two states on one...
Los Angeles County Office of Education
Assessment for the California Mathematics Standards Grade 5
Test young mathematicians' knowledge with an assessment aligned to California's fifth grade state standards. The exam covers a multitude of concepts including fractions and decimals, positive and negative numbers, measurement; and...
Curated OER
Hands On: Model Percent
In this model percents practice instructional activity, students sharpen their problem solving skills as they solve 6 story problems.
Curated OER
Percents and Discounts
Students convert between decimals and percents. In this algebra instructional activity, students define percent as it relates to sales and tax. They calculate the percents of number using multiplication.
Curated OER
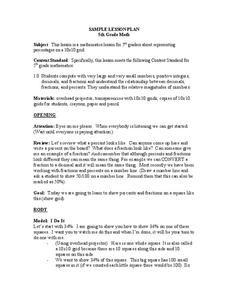
Percentages On A Grid
Fifth graders show percentages on a 10 x 10 grid. In this percentages lesson plan, 5th graders color in the squares to show a percent.
Curated OER
Converting fraactions and percents
Sixth graders practice the conversion of percents and fractions. They focus on the fact of both fractions and percents are part of a whole. In the independent practice the students also work with solving proportions.
Curated OER
The Meaning Of Percent
This lesson provides students with a variety of exercises which allow them to increase their ability to understand percentage.
Curated OER
SAT Grid Ins Practice Test 3
In this SAT grid in worksheet, students solve 10 practice SAT type problems. Students determine average, volume of prisms, sum of angles, etc.
Curated OER
How to Convert Percentages to Fractions and Decimals
Students can learn how to convert percents to decimals and fractions using 10x10 grids.
Curated OER
The Histogram
In this Algebra I/Algebra II instructional activity, learners construct and analyze histograms to develop a visual impression of the distributions of data. The two page instructional activity contains five problems. Answer...
Curated OER
Explore Surface Types on a Journey Around Earth
Students explore satellite data. In this technology cross-curriculum math and world geography lesson plan, students locate specific map areas using a microset of satellite data. Students use technology and math skills to determine...
