Curated OER
A Comparison Study of Water Vapor Data to Precipitation over North America
Learners use NASA satellite data to compare water vapor over the United States. For this data analysis lesson students use an Excel spreadsheet to map their data.
American Museum of Natural History
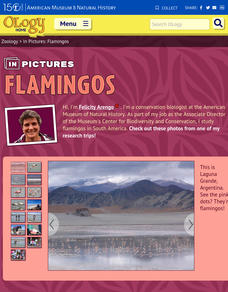
In Pictures: Flamingo
Fifteen photos take scholars on a journey to Laguna Grande, Argentina to observe how a group of scientists work with native flamingos. Stunning images showoff the flamingo, its environment, scientists in the wild, and the impact the...
Curated OER
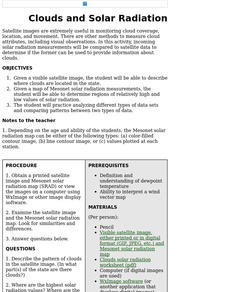
Clouds and Solar Radiation
Students examine how clouds affect incoming solar radiation. They compare and contrast satellite images and incoming solar radiation measurements as methods to provide information about clouds.
Curated OER
Tracking the Movement of Sunspots
Young scholars examine how the development of new technology has increased our knowledge of how the sun works. Students study sunspots through the use of solar imaging from satellite instruments.
Curated OER
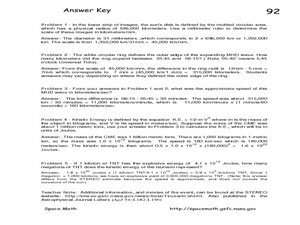
STEREO Watches the Sun Kick up a Storm!
In this solar storm worksheet, students use images of a solar tsunami to determine the size and speed of the wave. This worksheet has 5 problems to solve.
Curated OER
Roaming Biomes
Students use the Internet to research the capabilities of earth-observation satellites. Using the information, they write a report on how remote-sensing technology is used to measure the impact of climate change. They identify the...
Curated OER
Search for Ice and Snow
Learners use satellite images to locate areas of ice and snow on the globe. They create a table showing the information they gathered. They present their information to the class.
Curated OER
Mare Nubium and Las Vegas
In this satellite images worksheet, students observe two photographs taken by the LRO Satellite of downtown Las Vegas and the moon. They solve 3 problems including determining the size of craters in the...
Curated OER
Altimetry
Fifth graders accurately measure the distance to eight points on an uneven surface by conducting a simulation of sattelite altimetry. They create a two-dimensional model of the simulated ocean surface by graphing data from the Radar Run...
Curated OER
Tropical Atlantic Aerosols
Students analyze NASA data from the Multi-angle Imaging Spectroradiometer. In this NASA data lesson, students access an assigned website to examine information from the MISR on the Terra Satellite. They determine how desert dust travels...
Curated OER
Sunspots 3: Tracking the Movement of Sunspots
Students analyze sunspots through the use of solar imaging from satellite instruments. They collect two types of images, and track the movement of sunspots using a latitude/longitude grid.
Curated OER
Scenes of the Earth
Pupils examine and study how changes in perspective can change the way that they can observe objects. They explore the relationship between a scene's area and its detail. Each student looks at the ground through cardboard tubes from...
Curated OER
Phytoplankton and Ocean Color
Fifth graders identify function of phytoplankton in the biospere by conducting experiments and simulations and reading for information. They detect the presence of phytoplankton in bodies of water by examining ocean in satellite images...
Curated OER
Changing Planet: Melting Glaciers
Resource links to a video, satellite images, data, and photographs of glaciers provide emerging earth scientists the opportunity to examine how the ice has been retreating over the years. A data table is included for pupils to record...
Curated OER
Plate Tectonics - Evolution of the Earth
Tons of photographs, diagrams, animations, and satellite images fill the slides of an education earth science presentation. It begins with volcanic activity and earthquakes, and then moves into plate tectonics, boundaries, and driving...
PBS
Coastline Change
Continental drift happens over millions of years, but new perspective shows much faster changes. An informative resource offers a short term perspective using a series of satellite images. Viewers observe major changes to a coastline in...
PBS
Rain Shadows
Satellite images from NASA help scholars focus on the similarities on the planet rather than the differences. The photos from the installment of a larger PBS series exploring weather and climate compare geological formations in the...
PBS
Regional Patterns of Climate: Pacific Northwest
Climate systems involve sunlight, ocean, atmosphere, ice, land forms, and many other factors. Scholars explore each of these variables related to the Pacific Northwest rain forest. They use an online interactive to investigate the polar...
Curated OER
The Ancient Middle East
King Tutankhamon, Queen Nefertiti, and many other names literally written in stone are featured in these slides about the culture of Ancient Egypt. Whether used as an introduction to a unit on Egypt, or as a tool to elaborate on the...
Curated OER
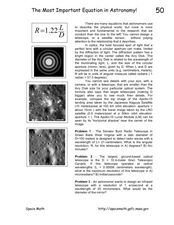
The Most Important Equation in Astronomy!
In this astronomy optics instructional activity, students calculate the angular resolution and maximum resolution for given telescope specifics. This instructional activity has 3 problems to solve.
Curated OER
Images, Empathy, and the Humanitarian Impulse
Students study humanitarian intervention and its role in society. In this politics lesson students view a video on Darfur and discuss what they learned.
Curated OER
Third from the Sun
Students examine images from space. In this third from the Sun lesson plan, students examine images from, Landsat, the satellite launched by NASA in 1972.
Curated OER
Magic Wand
Pupils observe how an image falling on a CCD array is divided into individual pieces, by the property of persistance of vision.
Curated OER
Sensing Somethong
Students are taught that they can gather information about objects using the five senses of vision, touch, smell, taste, and hearing. They are told that some sensing, like sight, is done remotely. Students observe how a camera can...

