Curated OER
Antibiotic Resistance in E. coli
Students discuss the antibiotic resistance of bacteria. They design an experiment to test the resistance of different strands of E. coli. They answer discussion questions to end the lesson plan.
Curated OER
Graphing Your Motion-Day 1
Ninth graders explore the concepts of motion, velocity and acceleration through graphing their own movement using LoggerPro. They become more familiar with the computer technology. Students explore graphing in real time and graph on...
Curated OER
Snow Cover By Latitude
Students examine computerized data maps in order to create graphs of the amount of snowfall found at certain latitudes by date. Then they compare the graphs and the data they represent. Students present an analysis of the graphs.
Curated OER
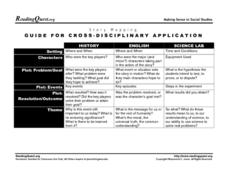
Story Mapping: Guide for Cross-Disciplinary Application
In this story mapping learning exercise, students read how story mapping can apply to 3 different areas of study: history, English and science lab. The components of story mapping that are included here are setting, characters,...
Curated OER
Olympic Line Graphs
Sixth graders examine how to make line graphs. In this Olympic line graph lesson students make line graphs and search the given Internet sites to find data on their summer Olympic Game.
Curated OER
Scientific Inquiry Pretest
In this scientific inquiry worksheet, students match words to definitions and fill in the blanks for scientific inquiry. Students complete 9 problems total.
Curated OER
Natural Dyeing with Plants - Scientific Method
Students study the components of scientific investigation by planning and carrying out an experiment in natural dyeing, seeing if different kinds of metal dye pots affect the color one gets from the same plant material.
Curated OER
Free Fall Graphing Exercise
Twelfth graders practice their graphing skills in an exercise about acceleration due to gravity. Lesson opens with a demonstration of acceleration due to gravity and a brief discussion. Students complete a worksheet and go over answers...
Curated OER
Interpreting Graphs
Students investigate graphs. In this graphing lesson plan, students create a graph regarding the population of California. Students extrapolate answers concerning the data set.
Curated OER
A Basic Photography Lesson
High schoolers explain the aesthetics of photography, take photos that demonstrate their understanding of aesthetics, and take photos that convey a message or tell a story. They analyze the qualities of a given photo.
Curated OER
Survival
Pupils determine the best material from which to make a jacket to keep the body warm in a cold, dry, windy climate. This task assesses the student's abilities to perform an entire investigation.
Curated OER
Quantitative Research
In this science worksheet, students find the words that are related to the design of experimental research and the answers are found at the bottom of the page.
Curated OER
Writing a Function Rule
In this Algebra I/Algebra II instructional activity, students determine the equation that correctly represents the relationship between the x and y values provided. The one page instructional activity contains four multiple choice...
Curated OER
What are the Odds
Students predict the-outcome of an event. In this algebra lesson plan, students compare and contrast the probability of an event occurring. They calculate the odds of a simple event and make estimation.
Curated OER
Spaghetti Bridges
Students thread a piece of spaghetti through the holes in the cup. One person suspend the cup by placing each index finger approximately one inch in from the ends of the spaghetti.
Curated OER
Spaghetti Bridges
Eighth graders experiment with building bridges of spaghetti, pennies, and a cup to determine how varying the number of spagetti pieces affects the strength of the bridge. They graph their results and interpret the data.
Curated OER
Choosing a Summer Job
What did you do over your summer vacation. Young wage earners must compare summer job options, and determine when each job earn the same amount and what that amount be. This be done by creating, graphing, and solving systems of...
Curated OER
Herb is the Word
Students graph the data collected on seedling establishment and
survival for each soil type over a 6 week period. Each lab group graphs data
gathered from one plant. They choose a color for each soil type and create a key for the...
Curated OER
Safety in the Biology laboratory
Pupils review safety in the biology laboratory. They summarize the rules and safety procedures by completing several activities such as practice questions, taking notes andbecoming familiar with the location of safety equipment.
Curated OER
Finding a Line of Best Fit
Pupils engage in the practice of creating a scatter plot with the data obtained from measuring different resting heart rates. The data is used to create the table that is translated into a graph. The lesson gives instructions for the use...
Curated OER
Scientific Problem Solving
In this problem solving learning exercise, learners will put the 7 steps to problem solving in a logical order. Then students will design a hypothetical study comparing a person's weight on Earth with his weight on Mars and complete 3...
Curated OER
From Playing with Electronics to Data Analysis
Learners collect and Analyze data. In this statistics lesson plan, students identify the line of best fit of the graph. They classify lines as having positive, negative and no correlation.
Curated OER
Saving the Bald Eagle
Students plot on a coordinate plane. In this algebra lesson, students identify points on a coordinate plane and graph lines given coordinate pairs. They create a model as they study bald eagles and their growth and decay.
Curated OER
Building a Rover
Students investigate properties of lines and points by making a rover. For this algebra lesson, students plot points correctly on a coordinate plane. They identify coordinate pairs given the plots and lines.


