Hi, what do you want to do?
TeachEngineering
Teach Engineering: Obi Wan Adobe: Engineering for Strength
Students conduct an experiment to determine how varying the composition of a construction material affects its strength. They make several adobe bricks with differing percentages of sand, soil, fibrous material and water. They test the...
Math Medics
S.o.s. Math: Graphs of Exponential & Logarithmic Function
This lesson gives brief description of dependent and independent variables and how they relate to the exponential and logarithmic functions.
Texas A&M University
Wtamu Virtual Math Lab: Intermediate Algebra
This site is a tutorial for students in algebra 2 or for those who need a refresher. The site has explanations, definitions, examples, practice problems and practice tests are found covering topics such as linear equations, graphing,...
Georgia Department of Education
Ga Virtual Learning: Causation
In this comprehensive interactive tutorial you will learn about cause and effect in disease occurrence.
Science Education Resource Center at Carleton College
Serc: Investigating Motion: Calculating and Graphing Students Walking Speed
In this activity students will collect and analyze data of their walking speed. They will compare their speed to an outside speed walker. They will determine their speed every 20 meters up to 100 meters. They will complete five trials to...
Rice University
Hyper Stat Online Statistics Textbook: Trend Analysis
A series of pages that help us understand testing one or more components of a trend using specific comparisons, a set of coefficients, error analysis of variance and the probability value.
Texas Instruments
Texas Instruments: Designing a Reaction Rate Experiment
In this activity, students will design, conduct, and report the outcome of an experiment in which they investigate some factor that affects the rate of reaction between baking soda and vinegar. The dynamic nature of the reaction, coupled...
Concord Consortium
Seeing Math: Function Analyzer
The Function Analyzer allows learners to see the connections among three representations of a function: symbolic, area, and graphic. In addition, by allowing learners to change the value of four elements of a function - the coefficient...
Khan Academy
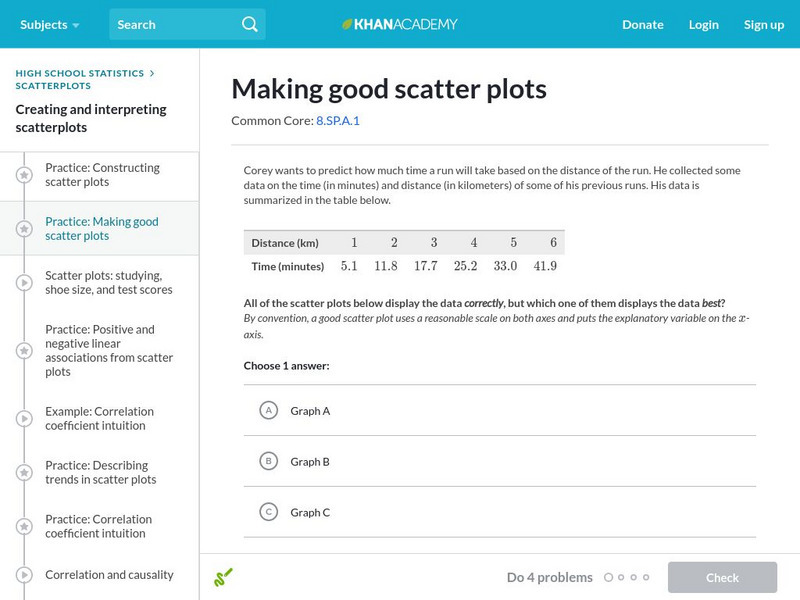
Khan Academy: Making Good Scatter Plots
A good scatter plot has the independent variable on the x-axis and the dependent variable on the y-axis. Also, the scale of both axes should be reasonable, making the data as easy to read as possible. In these practice problems, we...
Texas Instruments
Texas Instruments: Linear Relationship Between Weight and Quality
Students use a Force Sensor to collect weight versus number data for a collection of identical pennies and model the data using a linear equation. They will then interpret the slope as it relates to independent and dependent variables.
Alabama Learning Exchange
Alex: The Pattern of Graphing Linear Equations
The middle schoolers will extend the knowledge of algebraic expressions from geometric representations and ultimately graph linear equations with understanding. The students will also develop a better understanding of algebraic...
CK-12 Foundation
Ck 12: Algebra: Consistent and Inconsistent Linear Systems
[Free Registration/Login may be required to access all resource tools.] Identify a system as inconsistent, consistent, or dependent and determine how many solutions a system has.
Government of Alberta
Learn Alberta: Linear Systems Graph
Learn Alberta helps students visually explore various solutions of systems of two linear equations by allowing students to manipulate lines and view their numeric and graphic solution(s) or absence. The applet identifies the solutions as...
BSCS Science Learning
Bscs: Asking and Answering Questions With Data
This inquiry is intended to provide learners with practice developing investigable questions that need data, and specifically large datasets, to be answered. Click the teacher resources link for teaching guides and student handouts.
Other
Stat Soft: Statistics Glossary
Dozens of statistical terms are defined and illustrated in this glossary.
CK-12 Foundation
Ck 12: Biology: Science Experiments
[Free Registration/Login may be required to access all resource tools.] Introduction to scientific experiments.
Texas Instruments
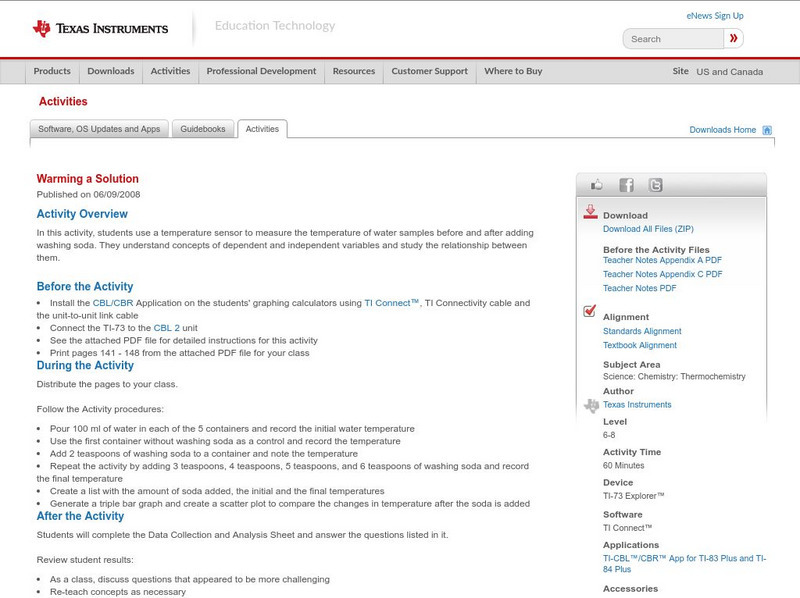
Texas Instruments: Warming a Solution
In this activity, students use a temperature sensor to measure the temperature of water samples before and after adding washing soda. They understand concepts of dependent and independent variables and study the relationship between them.
Texas Instruments
Texas Instruments: Bungee Jumper
Teacher will simulate a Bungee Jumper and have students predict when a Jumper would hit the ground.
Science Education Resource Center at Carleton College
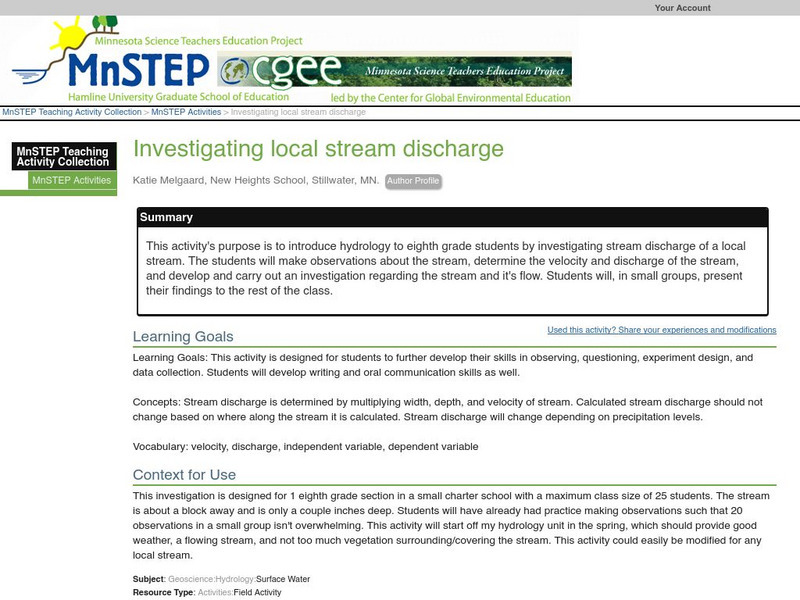
Serc: Investigating Local Stream Discharge
This activity's purpose is to introduce hydrology to eighth grade middle schoolers by investigating stream discharge of a local stream. The students will make observations about the stream, determine the velocity and discharge of the...
Northeast Parallel Architectures Center, Syracuse University
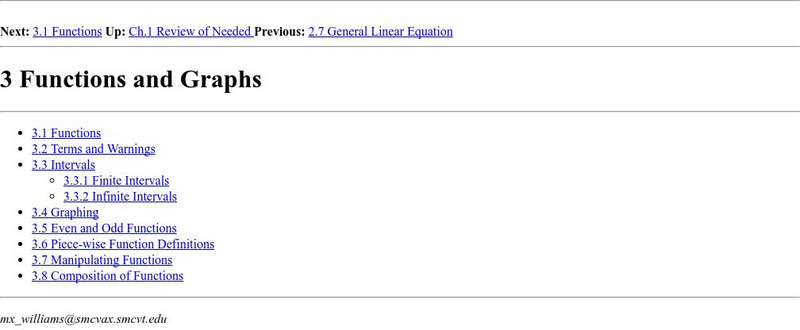
Npac Reu Program: Functions and Graphs
This site from the Northeast Parallel Architectures Center, Syracuse University contains a college level treatment of functions and graphs. Function, element, domain, range, piece-wise functions?? Stuff you know, stuff that's new. Very...
Other
Linear Functions, Slope and Regressions
Find activities here for linear functions, slopes and regression lines. Use them for classroom work or individual assignments.
CK-12 Foundation
Ck 12: Earth Science: Observations and Experiments
[Free Registration/Login may be required to access all resource tools.] Using observations and scientific experiments to test hypotheses.
CPALMS
Florida State University Cpalms: Florida Students: Tracking Distance Over Time
Using turtle migration to find the relationship when measuring distance over time.
CK-12 Foundation
Ck 12: Algebra: Determining the Equation of a Line
[Free Registration/Login may be required to access all resource tools.] No description available here...


