Pace University
Grades 7-8 Independent and Dependent Variables
It all depends upon the independence. The differentiated instruction lesson introduces learners to independent and dependent variables. Using real-world situations, scholars gain a conceptual understanding of the difference between the...
Virginia Department of Education
Independent and Dependent Variables
Investigate the relationship between independent and dependent variables. Individuals begin by identifying independent and dependent variables from different problem situations. Then, using specific guidelines, they create posters...
Curated OER
Interactivate: Introduction to Functions
This interactive website provides a variety of lesson plans according to which standards you are applying and which textbook you use. Introduce functions to your class by having them construct single operation machines and create...
Curated OER
Those Vexing Variables
Students recognize dependent and independent variables in an experiment by practicing manipulation of variables; students practice designing experiments that contain the two types of variables.
Curated OER
Algebra I: Linear Functions
Using rates from a rental car company, young mathematicians graph data, explore linear relationships, and discuss the role of slope and the y-intercept. This lesson allows for the discussion of independent and dependent variables, as...
EngageNY
Problems in Mathematical Terms
Whether scholars understand independent and dependent variables depends on you. The 32nd installment of a 36-part series has learners analyze relationships in real-world problems through tables. They determine independent and dependent...
EngageNY
Multi-Step Problems in the Real World
Connect graphs, equations, and tables for real-world problems. Young mathematicians analyze relationships to identify independent and dependent variables. These identifications help create tables and graphs for each situation.
Curated OER
Experimental Research
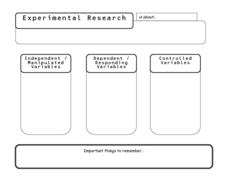
In this experiment worksheet, students give examples of independent, dependent, and controlled variables. This worksheet is a graphic organizer.
Curated OER
Graphing and Interpreting Linear Equations in Two Variables
Graph linear equations using a table of values. Learners solve equations in two variables using standard form of an equation. They identify the relationship between x and y values.
Cornell University
Polymers: Instant Snow
Is it easy to make snow? Scholars use critical thinking skills as they investigate the concept of polymers by making snow. The class tests several different variables and takes measurements over the course of several days. They then...
EngageNY
Representing Proportional Relationships with Equations
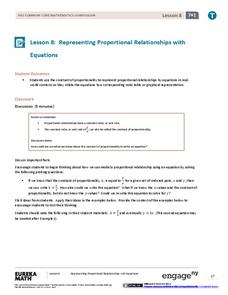
Use the constant of proportionality to relate the independent variable to the dependent variable. The eighth installment of a 22-part series instructs pupils to use the equation to find the constant of proportionality and then write the...
Curated OER
Forces and Graphing
Learners analyze graphs to determine relationships between variables and rates of change. They determine the basic concepts about static reaction forces. They determine the slope and equation of a line.
Curated OER
Looking At Variables
Learners predict and test different variables that would effect sugar cubes dissolving in water. In this dissolving lesson plan, students have 4 petri dishes with 4 different variations of sugar cubes and water. They predict which will...
Curated OER
Perimeter Pattern
High schoolers investigate perimeter patterns formed by a hexagon and a triangle. They will identify the dependent and independent variable and write a function for the relationship.
Curated OER
What's Your Shoe Size? Linear Regression with MS Excel
Learners collect and analyze data. In this statistics instructional activity, pupils create a liner model of their data and analyze it using central tendencies. They find the linear regression using a spreadsheet.
Curated OER
Series Solution of the Time-Independent Schrödinger Equation
In this math worksheet, students find the solutions to the problems that apply the time-independent Schrödinger equation. They examine the relationship between the mass and energy.
Curated OER
You Really "Affect" Me
Middle schoolers examine the effects of variables. They view a video which introduces the concepts, take part in an internet-based activity, then engage in a hands-on activity which allows them to practice what they have been studying.
Curated OER
Popcorn Science
Students identify and apply the scientific method through an experiment with popcorn. Then they identify what independent, dependent, and control variables are and create a list of different variables that affect popcorn popping....
Curated OER
Discovering Albedo
Students read a thermometer accurately, collect and record data, and generate a graph based on data. They learn what independent and dependent variables are. They analyze data and make conclusions concerning how soil coverings affect...
Curated OER
Guess the Age
Students describe graphically, algebraically and verbally real-world phenomena as functions; identify the independent and the dependent variable. They translate among graphic, algebraic, and verbal representations of relations and graph...
Curated OER
Variables
Students watch a video show how to identify the independent variable, dependent variable and controls in an experiment; and design experiments that use controls to isolate a single independent variable and measure the resulting dependent...
Curated OER
You Talkin' To Me?: Investigations in Animal Behavior
Middle schoolers investigate a variety of animal behaviors, examine various modes of animal communication, and develop a catalog analyzing, interpreting, and reporting their results.
Curated OER
The Pendulum
Students discover and discuss relationships and functions between varying dependent variables and how they affect the period of the pendulum. They use graphing calculator to express the data collected in a graph, to analyze the graph,...
Illustrative Mathematics
Chocolate Bar Sales
In this real-world example, algebra learners start to get a sense of how to represent the relationship between two variables in different ways. They start by looking at a partial table of values that define a linear relationship. They...
