Curated OER
Traffic Watch with a Palm
Students, in groups, interpret data about traffic using Palm technology.
Curated OER
SOME BASIC LESSON PRESENTATION ELEMENTS
Students review the Madeline Hunter Direct Instruction Model. They incorporate objectives, standards, anticipatory set and modeling. Students use guided practice/monitoring and closure daily.
Curated OER
Distribution of children living at home
Students examine census data to evaluate the number of students of certain ages living at home. This data is then used to determine the need for day care, or other social programs. They use this information to explore social policies.
Curated OER
Lesson 3: Understanding Population Growth
Young scholars explain population growth in Maryland and its relationship with age structure, household growth and consumption of land.
Curated OER
Antibiotic Resistance in E. coli
Students discuss the antibiotic resistance of bacteria. They design an experiment to test the resistance of different strands of E. coli. They answer discussion questions to end the lesson.
Curated OER
Pardon me. Do You Have exChange for a Dollar?
Young scholars are familiar with United States currency-dollar and cents. They are asked to compare it with currency of another country. Students explore currencies of various countries using the Internet, video, and hands-on...
Curated OER
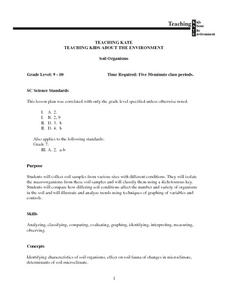
Soil Organisms
Students work together to collect soil samples from different locations. In the samples, they identify the macroorganisms and classify them. They identify the conditions that affect how macroorganisms grow. They also analyze and identify...
Curated OER
Sound
Second graders study how sound is produced by vibrations and is transmitted through matter in all directions. They observe how sounds are produced and identify the ways in which sound travels.
Curated OER
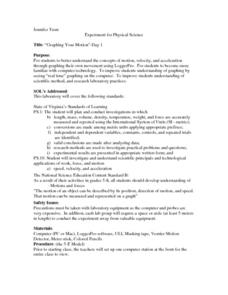
Graphing Your Motion-Day 1
Ninth graders explore the concepts of motion, velocity and acceleration through graphing their own movement using LoggerPro. They become more familiar with the computer technology. Students explore graphing in real time and graph on...
Curated OER
Snow Cover By Latitude
Students examine computerized data maps in order to create graphs of the amount of snowfall found at certain latitudes by date. Then they compare the graphs and the data they represent. Students present an analysis of the graphs.
Curated OER
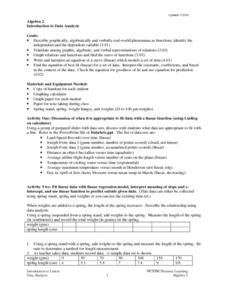
Introduction To Data Analysis
Seventh graders investigate the concept of looking at the data put in a variety of ways that could include graphs or data sets. They analyze data critically in order to formulate some sound conclusions based on real data. Students graph...
Curated OER
Mathematical Relationships
Students practice graphing a linear equation and a parabolic equation. They work cooperatively to select numbers, including fractions, which they will put into ordered pairs. Students explain their process to the class, discussing what...
Science Buddies
Science Buddies: Scientific Method Variables/hypothesis
Find out what variables are in a scientific investigation and what the difference is between an independent, dependent, and controlled variable. Look at samples of different types of variables and find out what makes a good variable.
Illustrative Mathematics
Illustrative Mathematics: F if Points on a Graph
This task will help students understand the difference between between independent and dependent variables. Aligns with F-IF.A.1.
Shodor Education Foundation
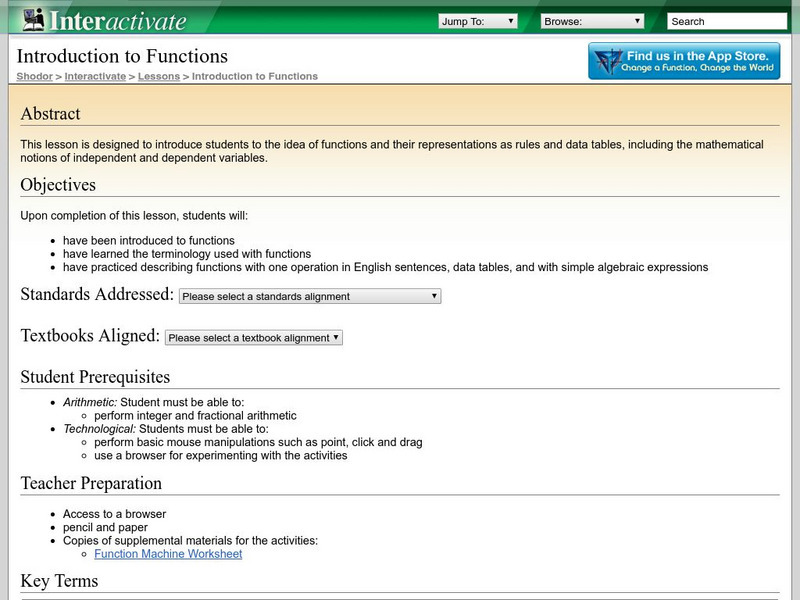
Shodor Interactivate: Lesson: Introduction to Functions
Input numbers into the function machine and explore independent and dependent variables.
Shodor Education Foundation
Shodor Interactivate: Lessons: Advanced Fire
Lesson plan to help students understand independent and dependent variables through a fire probability simulation.
Science Education Resource Center at Carleton College
Serc: Investigating Motion: Calculating and Graphing Students Walking Speed
In this activity students will collect and analyze data of their walking speed. They will compare their speed to an outside speed walker. They will determine their speed every 20 meters up to 100 meters. They will complete five trials to...
BSCS Science Learning
Bscs: Asking and Answering Questions With Data
This inquiry is intended to provide students with practice developing investigable questions that need data, and specifically large datasets, to be answered. Click the teacher resources link for teaching guides and student handouts.
Science Education Resource Center at Carleton College
Serc: Investigating Local Stream Discharge
This activity's purpose is to introduce hydrology to eighth grade students by investigating stream discharge of a local stream. The students will make observations about the stream, determine the velocity and discharge of the stream, and...
Shodor Education Foundation
Shodor Interactivate: Lesson: More Complicated Functions: Intro Linear Functions
In this instructional activity, students learn about linear functions and how they can be represented as rules and data tables. Includes a worksheet with exploration questions to accompany an interactive Linear Function Machine. The...
Other
Nearpod: Distance Time Graphs
In this instructional activity on distance-time graphs, learners will understand graphing by analyzing distance-time graphs.
Alabama Learning Exchange
Alex: The Pattern of Graphing Linear Equations
The students will extend the knowledge of algebraic expressions from geometric representations and ultimately graph linear equations with understanding. The students will also develop a better understanding of algebraic expressions by...
Science Education Resource Center at Carleton College
Serc: Flow Characteristics of the Crow River
Students make observations of a local river, and then formulate a question. Then, through guided inquiry, construct, conduct, and collect data on a question they wish to research. Students keep a field journal of their observations,...


