Richland Community College
Rcc: Solving Inequalities Algebraically and Graphically
Straightforward explanations on how to solve inequalities. Includes linear inequalities, double inequalities, absolute value inequalities, polynomial inequalities, and rational inequalities.
CK-12 Foundation
Ck 12: Algebra: Absolute Value Equations and Inequalities Study Guide
This comprehensive study guide highlights the main terms and formulas needed to understand absolute value equations and inequalities. Examples are included.
Khan Academy
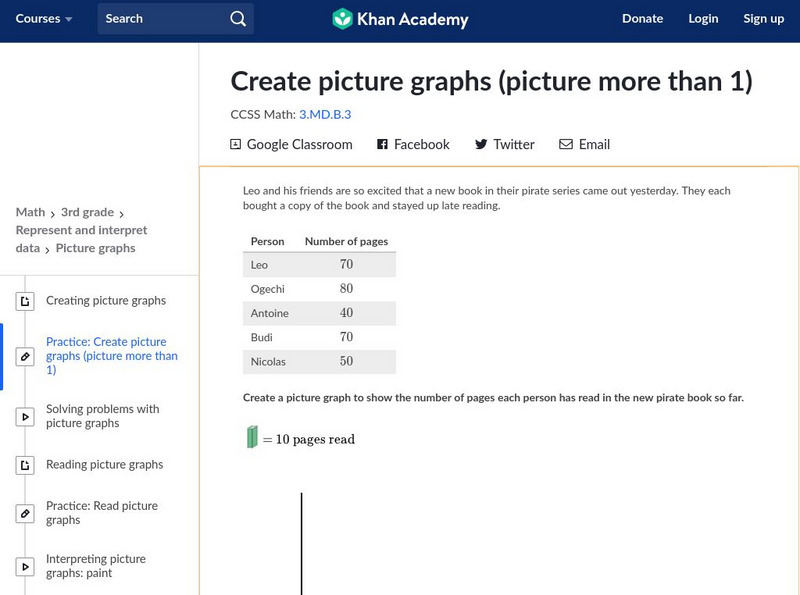
Khan Academy: Create Picture Graphs (Picture More Than 1)
Create and interpret picture graphs. Students receive immediate feedback and have the opportunity to try questions repeatedly, watch a video tutorial, or receive hints about how to create picture graphs. CCSS.Math.Content.3.MD.B.3 Draw a...
Richland Community College
Richland Com. College: Graphing Systems of Inequalities
Thyis site offers problem solving systems and graphing systems of inequalities. Illustrations included.
Texas A&M University
Wtamu Virtual Math Lab: Beginning Algebra: Solving Linear Inequalities
This tutorial will show you how to use various properties of inequalities in order to solve linear inequalities and how to graph solution sets on a number line. Offers several examples showing you steps to solving inequalities and...
Texas A&M University
Wtamu Virtual Math Lab: College Algebra: Rational Inequalities
Use this tutorial to learn how to solve rational inequalities by using a sign graph of factors and by using the test-point method. Offers a good collection of step-by-stem solutions and practice problems for you to complete.
Oswego City School District
Regents Exam Prep Center: Systems of Linear Inequalities
Solving a system of linear inequalities is shown to be as easy as solving a system of linear equations! An example is explained before students are given several problems to complete on their own. Complete explanations of these are...
Illustrative Mathematics
Illustrative Mathematics: F if Identifying Graphs of Functions
For this task, students are presented with four function equations and four graphs of functions showing -2 less than or equal to x, which is less than or equal to +2. They are asked to match each function to the corresponding graph and...
Khan Academy
Khan Academy: Two Variable Inequalities From Their Graphs
Fit an algebraic two-variable inequality to its appropriate graph.
Texas A&M University
Wtamu Virtual Math Lab: College Algebra: Quadratic Inequalities
Using this tutorial, you'll learn two methods of solving quadratic inequalities: using a sign graph of factors and using the test-point method. Offers step-by-step written examples, and practice problems for you to complete.
University of Regina (Canada)
University of Regina: Math Central: Graphing a System of Inequalities
A solution is presented to a student-submitted problem. The problem involves graphing and finding the solution set to a system of inequalities.
Illustrative Mathematics
Illustrative Mathematics: A ced.a.2 and a ced.a.3: How Much Folate?
This task is designed to be used as an introduction to writing and graphing linear inequalities. Aligns with A-CED.A.2 and A-CED.A.3.
Math Open Reference
Math Open Reference: Graphical Function Explorer (Gfe)
This resource provides a free function grapher. Enter up to 3 equations and plot them. Similar to a graphing calculator.
Alabama Learning Exchange
Alex: Finding the Slope of a Line
This lesson will use a slide presentation to facilitate teaching students how to find the slope of a line when given the graph of the line or two points. Students will interact with the presentation in two ways: first, by taking notes...
University of Saskatchewan (Canada)
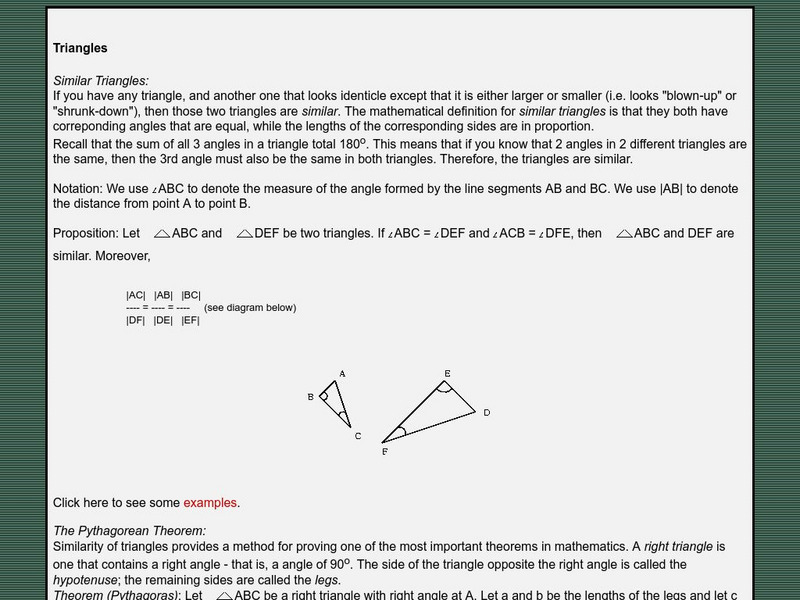
University of Saskatchewan: Triangles
This site from the University of Saskatchewan provides an explanation of similar triangles, the Pythagorean theorem, and the distance between arbitrary points in a plane. Example problems for each of these concepts are provided.
Math Planet
Math Planet: Algebra 2: Line Plots and Stem and Leaf Plots
Provides examples and a video lesson that illustrate line plots and stem-and-leaf plots. [1:12]
Other popular searches
- Graphing Linear Inequalities
- Graphing Inequalities
- Math Graphing Inequalities
- Graphing Compound Inequalities
- Algebra Graphing Inequalities


