Curated OER
Fishy Frequencies
Tenth graders demonstrate that natural selection is an agent of evolution. They quantitatively apply the Hardy-Weinberg Principle to an imaginary population of fish. They utilize math and graphing skills, collecting and analyzing data,...
Curated OER
Fit With Fiber
Sixth graders investigate the nutritional value of different types of cereal. They take a survey of students that ate breakfast and create a circle graph with the results. Students examine the nutritional information on the sides of the...
Curated OER
Farming: It's a Fact!
Students use worksheets, food items, and computer programs to learn about the path of food from the farm to their meals. In this agriculture lesson, students use a provided worksheet to learn facts about farming. They use a bag of...
Curated OER
Go Car, Go!
Students design and build their own car. In this physics lesson, students collect data to determine the speed of the car. They plot the data on the graph analyze the relationship between variables.
Curated OER
A Child's Journey through Medicine
Students experience a variety of activities that relate to human physiology and their functions. They create graphs and charts after testing their heart rates and blood pressure They conduct a survey of the student body and create ...
Curated OER
The Legend of Jack-O'-Lantern
Students examine various Halloween traditions and the legend of the Jack O'Lantern. They listen to the story "Pumpkin Pumpkin," examine a map and locate the origins of pumpkins, weigh and measure a pumpkin and graph the results, and...
Curated OER
Survey and Tally
Second graders view a model of a survey and tally. In this survey and tally lesson, 2nd graders decide on questions for a survey. Students conduct the survey and tally their results. Students create a tally chart....
Curated OER
Front Page News
Students write original earthquake articles typically found on the front page of a newspaper. Each student has the freedom to write in a variety of writing styles (lead story, human interest story, editorials, etc.). They research...
Curated OER
ACC Basketball Statistics
Middle schoolers use math skills and create a spreadsheet. In this statistics and computer skills lesson, students gather ACC basketball statistics, convert fractions to decimals and then percents. Middle schoolers use the gathered...
Curated OER
Wreck Detectives
Students investigate shipwrecks. In this marine archaeology instructional activity ,students collect data and make inferences about the causes of shipwrecks. Students work in groups to create their own model of a shipwreck using clay....
Curated OER
Plant Parts We Eat
I bet the kids in your class will love to eat their vegetables after an engaging lesson about edible plants. They read information about vegetables and edible plants, sort vocabulary words, identify plant parts, measure and graph the...
Curated OER
Predator-Prey Simulation
In this predator-prey worksheet, students simulate the relationship between predators and prey using small squares to represent rabbits and large squares to represent coyotes. They complete 20 rounds of the simulation trying to get the...
Curated OER
How Far Did They Go?
Students create a map. In this direction and distance lesson, students come up with familiar places in the community and calculate the distances from these places to the school. Students create a map that displays these places and their...
Curated OER
Quadratic Functions and Stopping Distance
Students solve quadratic equations. In this algebra lesson, students factor and graph quadratic functions. they use the properties of quadratics to calculate the distance.
Curated OER
The Disappearing Honeybees: Tracking Honeybee Decline
Students practice graphing and other math skills to track number of honeybee colonies present in United States since 1978, discuss major crops that are dependent on insect pollinators, and examine reasons for decline of United States...
Curated OER
Exploring for Petroleum - Modeling an Oil Reserve
Students experiment with locating oil reserves. For this conservation lesson, students use a cardboard box to create sand, rocks, and an oil reserve (water balloon). They use a probe to dig around in the box to find the oil reserve and...
Curated OER
Modeling an Oil Reserve
Students conduct an experiment. In this oil and natural gas instructional activity, students learn how geoscientists identify and explore reserves of petroleum. Students make a model of an oil reserve, record how much it...
Curated OER
What Shapes a MPA?
Students identify the three types of MPA in California. In this marine science lesson, students analyze information provided to design a new MPA. They justify their reasoning in class.
Curated OER
A Child's Journey Through Medicine
Fifth graders identify the symptoms of asthma. In this biology lesson, 5th graders draw and label models of heart and lungs. They conduct a survey on asthma and construct graphs based on result.
Alabama Learning Exchange
Investigating School Safety and Slope
Learners investigate the slope of various stairways through a "news report" approach and employ mathematical knowledge of applied slope to report on wheelchair accessibility and adherence to Americans with Disabilities Act. They...
Curated OER
The Jellybeans and the Big Dance
Enchant your youngsters by reading them The Jellybeans and the Big Dance, by Laura Numeroff and Nate Evans. Ask them to name objects that begin with the letter J like jellybeans. Give each of them some jellybeans to sort by color....
Curated OER
State Database Lesson
Fifth graders create a database about the geography of the United States. The access to a computer is essential for this lesson plan. The outcome is that technology is used as a tool to measure student understanding of geographical...
Curated OER
Pets Galore!
Fourth graders conduct a class survey on the number of pets that the 4th grade owns and they record that data in their math notebooks. They make a bar graph displaying the results using a spreadsheet through Microsoft Excel.
Curated OER
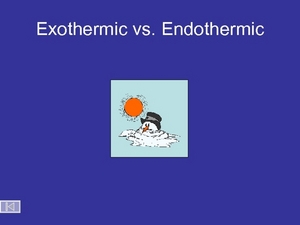
Exothermic vs. Endothermic
The PowerPoint opens with video footage of the decomposition of nitrogen triiodide and then explains it with diagrams. Graphs of exothermic and endothermic reactions are exhibited, as well as one for the effect of a catalyst on reaction...
