Curated OER
Standard Linear Form
Ninth graders identify and describe the x-intercept as the place where the line crosses the x-axis as it applies to football. They create their own differentiations to reinforce the distinction between the x-intercept and the...
Curated OER
Point-Slope Form
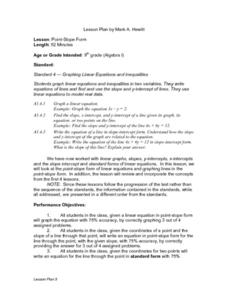
Ninth graders explore the point-slope form of linear equations and graph lines in the point-slope form. After completing the point-slope equation, they identify the slope of a line through a particular point. Students explain the...
Curated OER
What is My Favorite Apple?
Students decide on their favorite apple and together make a graph.
Curated OER
Equations With Radical Expressions
Students solve systems of equations with radical expressions. After reading real life situation, they translate the problem into algebraic expressions. As a class, students solve quadratic equations and inequalities by graphing and...
Curated OER
Negative Numbers on the Number Line Using the TI-83
In this negative numbers worksheet, students use the TI-83 calculator to compare the value of negative numbers. Students explain in short answer format how they used the calculator to determine their answers.
Curated OER
Linear Systems
Students solve and graph linear equations. In this algebra lesson, students solve systems of equations using elimination and substitution. They graph their answer and identify the point of intersection.
Creative Chemistry
Alkanes and Alkenes
In this alkanes activity, students use a data table to plot a graph of boiling point against the number of carbon atoms. They also define cracking and double bonds. This activity has five short answer questions.
Curated OER
Lesson 3: The Quadratic Equation
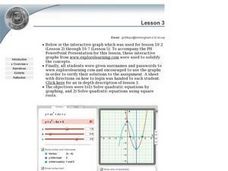
Students explore quadratic equations. They use interactive graphs (on the Internet) to verify and solve solutions. Students solve quadratic equations by using square roots. Students examine examples of inequalities.
Curated OER
Energy Costs of Walking and Running
In this energy worksheet, students use a data chart comparing the energy used while running and walking to create a graph and complete 2 short answer questions.
Alabama Learning Exchange
The Very Hungry Class
Students listen to a read aloud of Eric Carle's, The Very Hungry Caterpillar, as an introduction to their study of the metamorphosis of a butterfly. They participate in a number of cross-curricular activities in this unit of lessons.
Curated OER
Jelly Belly: What a Wonderful "Bean"!
Students explore how jelly beans are produced. They discuss the origins of the jelly bean and view a video about how jelly beans are prepared, tested, shaped, finished, and shipped and estimate the amount of jelly beans in a jar and sort...
Curated OER
I Can Do This! Systems of Equations
Students solve systems of 2-by-2 linear equations using tables,
graphs and substitution. In small groups, classmates work together to discover strategies for solving equations. They use a calculator to graphically represent their answers.
Curated OER
Specific Heat and Insulation
Students measure the air and soil temperatures at designated times. They graph the temperatures of each on one piece of graph paper with different colors. Students compare the information for the two line plots and analyze their results...
Curated OER
Genetic Variations in Hand Span Size
High schoolers study genes. In this biology lesson plan, students measure their handspan size to determine if one pair or many pairs of genes control that trait.
Curated OER
Word Stress and Sentence Stress
Young scholars use the correct stress in words and in sentences to correct their pronunciation. In this pronunciation lesson plan, students are provided many words and sentences to practice the stresses correctly.
Curated OER
Butterflies
Students will explore the life cycle of the Painted Lady butterfly by raising their own. They will incorporate math, science, and language arts as they graph, pattern, journal, observe, and artistically create.
Curated OER
The Swinging Pendulum
Students observe a pendulum and graph their observation. In this algebra lesson, students use the TI calcualtor to graph the motion the pendulum makes. They analyze the graph and make predictions.
Curated OER
Optimization For Breakfast
Young scholars identify he proportion of a cereal box. In this algebra activity, students define the relationship between patterns, functions and relations. They model their understanding using the cereal box.
Curated OER
The Number Line
Eighth graders investigate the order of numbers and how they are located on the number line. They also review the symbols used to compare quantities in order to decipher simple expressions and graph them on the numberline.
Curated OER
Take Me Out To the Ball Game
Young scholars use a map to graph and locate major league teams of different sports. In groups, they analyze the population data of the United States and compare it with the amount and location of the major league teams. They share their...
Curated OER
Organizing And Reading Data
Students complete three parts of an "Organizning and Reading Data" worksheet. First, they go over the rubric to determine the work will be scored. They organize data by taking tallies, make a pictograph and a bar graph using the data....
Curated OER
Water in the Texas Coastal Basins
Learners, after researching a Texas coastal basin, map and graph the information they collect and then translate it into a short report to be presented to their classmates. They brainstorm unique ways to maintain Texas estuaries as well...
Curated OER
Ice Melting Investigation
Students conduct an ice melting investigation in which they observe and measure the melting of two ice spheres. They develop a hypothesis as to which sphere will melt the fastest, collect data every ten minutes, and graph the data using...
Curated OER
Collecting And Fitting Quadratic Data
Young scholars investigate the concept of using quadratic data to plot coordinates on a plane. They also apply the quadratic formula for a variety of problems with the help of a graphing calculator to draw the parabola for given...

