Curated OER
The Circle Graph
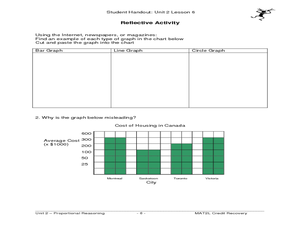
In this circle graph worksheet, students complete problems involving many circle graphs including a compass rose, degrees, and more. Students complete 7 activities.
Curated OER
Every Graph Tells A Story
Seventh graders explore linear equations. In this graphing activity, 7th graders explore constant rates of change. Students discover the real-life application of graphs and demonstrate their ability to read graphs and write...
Curated OER
Using Graphs and Charts
Students complete T charts and manipulate numbers using graphs and charts. In this math graphs and charts lesson, students review the concepts of pattern and function. Students then complete practice pages where they manipulate numbers...
Curated OER
Graphing Data
First graders explore the concept of graphing. In this data lesson, 1st graders gather information from a class survey and display their findings on a picture graph. Students also practice solving problems that their instructor models.
Curated OER
Making Graphs
Students explore statistics by conducting class demographic surveys. In this graph making lesson, students identify the family members of each classmate, pets they own, and favorite activities. Students organize their statistics and...
Curated OER
Problem Solving: Use a Graph: Problem Solving
In this bar graph activity, students read the word problem and use the bar graph to complete the problem solving questions for understand, plan, solve, and look back.
Curated OER
Linear Inequalities
Students explore how to graph a linear inequality. They determine if a point is in the solution set. Students solve linear inquality application problems. They graph linear equations, and solve linear equations for a given variable.
Curated OER
Doctor, Doctor, Give Me the News, I've Got a Bad Case of Loving Math
Solve a real-world problem of discovering how many doctors and nurses can be hired within budget and building constraints. Using different colored pencils to shade each graph, they then find the intersection points and use these to solve...
Curated OER
MP3 Purchase Plans
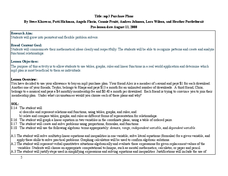
Use algebra to solve real world problems. Mathematicians practice use of graphs, tables, and linear functions to solve a problem regarding mp3 purchase plans. They work in groups to solve the problem and present their findings and...
Curated OER
Linear Equations
This is a great instructional activity from start to finish. With partners and on their own, learners write and solve linear equations and inequalities. They use manipulatives, group work, and an included worksheet to make magic with...
Curated OER
Long Distance Phone Plans
In this long distance phone plane worksheet, students compare various phone plans and determine which long distance plan has the greatest savings. Students support their answers visually through the use of tables and graphs. They write...
Curated OER
Quadratic Formula
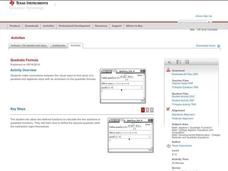
Mathematicians determine the solutions of a quadratic function by looking at a graph. They use the quadratic formula to solve quadratic functions on their Ti-Nspire.
Concord Consortium
Graphical Depictions
Parent functions and their combinations create unique graphical designs. Learners explore these relationships with a progressive approach. Beginning with linear equations and inequalities and progressing to more complex functions,...
Flipped Math
Unit 3 Review: Systems of Equations
More practice makes perfect. A review packet helps pupils remind themselves of the content of the unit. They determine whether points are solutions to linear equations, graph systems of equations and inequalities, and solve systems of...
PBL Pathways
Boogie Boards
Solve a complex business puzzle by building a linear programming model. An engaging project-based learning problem has classes examining transportation costs and manufacturing limitations from several plants. Ultimately, they use their...
Radford University
Linear Programming: Sports Shoes
Don't shoo away the resource on shoes. Given constraints on the amount of leather and string needed to make two different types of shoes, learners graph a system of inequalities for the situation. They then determine the maximum profit...
Curated OER
Equations and Inequalities
In this equations and inequalities worksheet, 9th graders solve and graph 8 different problems that include various systems of equations. First, they determine the solution to each set of system of equations. Then, students graph the...
Curated OER
Solving Absolute Value Inequalities
Start this activity with a brief description of how to solve absolute value inequalities. A space is provided to help classify the inequalities into types (greater than, less than, or equal to) and for learners to show how to graph their...
CK-12 Foundation
Cliff Diver
Cliff diving is more than an adrenaline rush ... it's a lesson in physics! Scholars adjust the height of a cliff and plot the resulting velocity and position over time on graphs. They also can incorporate air resistance to monitor the...
Mathed Up!
Negative Scale Factor
Class members investigate the effect of a negative scale factor dilation on coordinate shapes as they watch a short video that shows an example of a geometric figure undergoing a dilation with a negative scale factor. Learners then try a...
Mathematics Vision Project
Module 7: Structure of Expressions
The structure of an expression is a descriptive feature. Learners build a solid understanding of quadratic functions using an analysis of expressions in different forms. The seventh module in a series of nine includes 12 lessons...
Curated OER
Three for the Money: The Degree/Diameter Problem
Students explore the degree, diameter, planarity, and size of graphs. In this degree, diameter, planarity, and size of graphs lesson, students try to construct a graph with more than 12 vertices that satisfy all other...
Cornell University
Non-Newtonian Fluids—How Slow Can You Go?
Children enjoy playing with silly putty, but it provides more than just fun. Young scientists make their own silly putty using different recipes. After a bit of fun, they test and graph the viscosity of each.
Mathalicious
Domino Effect
Carryout the instructional activity to determine the cost of pizza toppings from a Domino's Pizza® website while creating a linear model. Learners look through real data—and even create their own pizza—to determine the cost of each...
