Shodor Education Foundation
Regression
How good is the fit? Using an interactive, classmates create a scatter plot of bivariate data and fit their own lines of best fit. The applet allows pupils to display the regression line along with the correlation coefficient. As a final...
Curated OER
Systems of Linear Inequalities
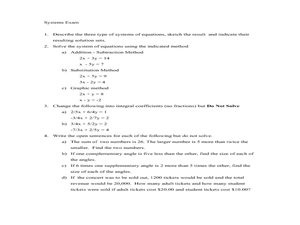
In this systems of linear inequalities worksheet, 9th graders solve and complete 10 various types of problems. First, they determine whether a given point is in the solution set of a system of linear inequalities. Then, students graph...
Curated OER
Solving Inequalities with Fractional Coefficients
In this algebra worksheet, students solve inequalities by factoring. They graph their solution on a number line. There is an answer key.
Curated OER
Division of Monomials
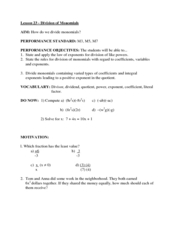
Students relate the division of monomials to multiplication. In this division of monomials lesson plan, students divide monomials by factoring and dividing common factors from the originals. They check their answers by multiplication. As...
Curated OER
Solving Equations with Fractional Coefficients
In this algebra learning exercise, students solve equations with fractions. They solve equations with decimals as well. There are 17 questions with an answer key.
Kenan Fellows
Climate Change Impacts
Turn up the heat! Young mathematicians develop models to represent different climates and collect temperature data. They analyze the data with regression and residual applications. Using that information, they make conclusions about...
Mathematics Vision Project
Modeling Data
Is there a better way to display data to analyze it? Pupils represent data in a variety of ways using number lines, coordinate graphs, and tables. They determine that certain displays work with different types of data and use two-way...
Curated OER
Word Problems
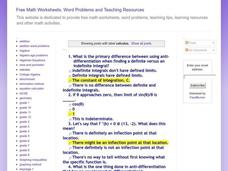
In this calculus worksheet, students use integration to solve word problems they differentiate between integration and anti derivatives, and between definite and indefinite integrals. There are 3 questions with an answer key.
Mathematics Vision Project
Module 1: Getting Ready Module
This fabulous resource is a must-have for any algebra teacher's arsenal of lessons. Developing the idea of equations and use of variables from basic physical scenarios, learners gain valuable intuition in the structure and meaning of...
EngageNY
Analyzing Data Collected on Two Variables
Assign an interactive poster activity to assess your class's knowledge and skill concerning data analysis. The teacher reference provides solid questions to ask individuals or groups as they complete their posters.
Shodor Education Foundation
Data Flyer
Fit functions to data by using an interactive app. Individuals plot a scatter plot and then fit lines of best fit and regression curves to the data. The use of an app gives learners the opportunity to try out different functions to see...
Shodor Education Foundation
Multi-Function Data Flyer
Explore different types of functions using an interactive lesson. Learners enter functions and view the accompanying graphs. They can choose to show key features or adjust the scale of the graph.
Curated OER
Graphs and Data
Students investigate poverty using graphs. In this algebra lesson, students collect data on the effects of poverty and use different rules to analyze the data. They graph and use the trapezoid rule to interpret the data.
Curated OER
Math TODAY Challenge - New Color of Money
Students read about the changes in the "new money" and then create a graph to represent various combinations of currency produced.
Curated OER
Volumes in 3-D
In this geometry worksheet, 11th graders calculate the volume of there dimensional shapes using the formula for cylinders. They are given the height and the base and asked to calculate the volume. There are 4 problems.
Curated OER
Finding the Vertex of a Quadratic Function
Students solve quadratic equations and identify the vertex. In this algebra instructional activity, students factor quadratic equations and identify the different properties of a parabola. They graph the functions using the vertex and...


