US Department of Commerce
How Are Single-Parent Households Distributed Across the United States?
There sure are a lot of single-parent households in the country. After selecting one of four US regions to investigate, pupils create dot plots and box plots on the percentage of single-parent households with male parents and female...
Curated OER
Button Bonanza
Collections of data represented in stem and leaf plots are organized by young statisticians as they embark some math engaging activities.
Illustrative Mathematics
Speed Trap
In which direction is traffic moving faster, north or south? Use box and whisker plots to organize data and interpret the results. Detailed solutions are included. This activity would be good as a warm up or quick assessment at the...
Illustrative Mathematics
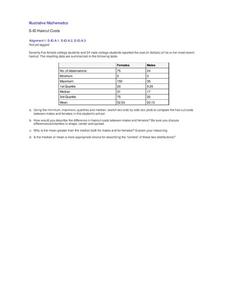
Haircut Costs
Who pays more for haircuts, men or women? Given quartile values, learners construct box and whiskers plots and interpret the results. They compare the mean and median, and discuss which is more appropriate under particular conditions....
National Council of Teachers of Mathematics
Eruptions: Old Faithful Geyser
How long do we have to wait? Given several days of times between eruptions of Old Faithful, learners create a graphical representation for two days. Groups combine their data to determine an appropriate wait time between eruptions.
Texas Instruments
Texas Instruments: Box Plots: How Many Pairs of Socks
The purpose of this lesson is to help students use the shape of a line plot to interpret the shape of a box plot.
Texas Instruments
Texas Instruments: Get on the Stick
In this activity, students use a CBR 2 to measure the reaction time of catching a stick. They also learn how to interpret a box plot, and make a five number summary of a single variable data set.
Texas Education Agency
Texas Gateway: Tea Statistics: Descriptive Statistics: Introduction
In these exercises to introduce descriptive statistics, students will construct a histogram and a box plot, calculate univariate statistics, and interpret the data in the graphs.
Oswego City School District
Regents Exam Prep Center: Practice With Organizing and Interpreting Data
Several problems are presented to test your skills in creating and interpreting frequency tables, pie charts, box-and-whisker and stem-and-leaf plots.


