Curated OER
Social Studies: A Ticket to Japan
Fourth graders create Venn diagrams to compare and contrast life in the United States and Japan. While the teacher holds up word cards, they decide where to categorize them under Japan, the U.S., or both. As students assemble their...
Curated OER
What are Quarters Made of?
Students study the meaning, symbolism, and value of U.S. coins,
especially the quarter. They l research why in 1965 the U.S. Mint decided to
change the metal composition of the quarter to copper coated with zinc. In addition, they...
Curated OER
Bill of Rights -- Texas v. Johnson, 1989
Learners examine the First Amendment of the Bill of Rights. During a visit to the George Bush Presidential Museum, they watch a video about the Texas v. Johnson flag burning case. In groups, they discover the role of the Supreme Court...
Curated OER
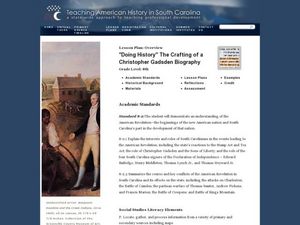
"Doing History" The Crafting of a Christopher Gadsden Biography
Learners reflect on the biography of General Gadsden. In this history lesson, students read the biography of General Gadsden then research a specific aspect of the Generals life to complete their own biography pn him.
Curated OER
Mother May I?
Third graders measure distance using nonstandard units of measure. In this measurement lesson, 3rd graders measure a given distance through the use of the game "Mother May I?" Student gather and compare data on how many "giant steps" and...
Curated OER
Pythagorean Theorem
Young scholars solve right triangles using the Pythagorean Theorem. For this solving right triangles using the Pythagorean Theorem lesson, students find the missing side of a right triangle. Young scholars find the hypotenuse...
Curated OER
Pieces of the Past
Seventh graders compare and contrast the way of life of Native Americans in Texas and around the country. As a class, they brainstorm about the uses of pottery today and use broken pieces of pottery to create an artifact. In groups,...
Texas Education Agency
Texas Gateway: Synthesize Information in Charts and Graphs (English Ii Reading)
Synthesize information that you find in charts and graphs.
Quia
Quia: Reading Charts and Graphs Quiz
This 25-question quiz asks students to read various kinds of charts and graphs and to select the correct answers to the questions. Immediate feedback is provided after each question. Java is required.
Beacon Learning Center
Beacon Learning Center: Interpreting Line Graphs
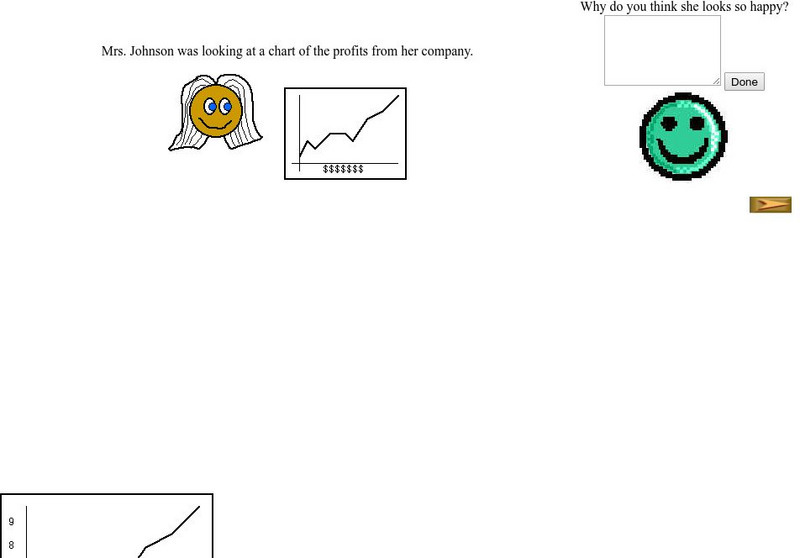
This site is a lesson on creating and interpreting a line graph. It explains how a line graph is created and then asks questions about what is learned from the data. Students type in open responses, and answers and feedback follow.
Texas Education Agency
Texas Gateway: Evaluating Data in Tables, Graphs and Charts
[Accessible by TX Educators. Free Registration/Login Required] In this lesson students look at examples of graphics, tables, charts, and graphs, and learn how to interpret their data. They will be able to use this skill to enhance their...
Education Development Center
Tune in to Learning: Reading Charts and Graphs
Practice graph reading skills with these exercises and companion tutorials.
Other
The Topic: Charts and Graphs
Brief descriptions of charts and graphs, followed by links to larger sites on the same subject.
Texas Education Agency
Texas Gateway: Analyze Graphical Sources: Practice 2 (English I Reading)
This lesson focuses on practice exercises to understand and interpret the data in a graphic representations including pie charts, bar graphs, and line graphs.
E-learning for Kids
E Learning for Kids: Math: Elephant Plant: Data and Graphs
On this interactive website students practice various math skills using a real-life scenario involving plants. Those skills include interpreting data in a circle graph, interpreting data in a divided bar graph, and interpreting a bar...
Other
Hubspot: Data Visualization 101: How to Design Charts and Graphs
Your data is only as good as your ability to understand and communicate it, which is why choosing the right visualization is essential. Learn more in this guide.
US Department of Education
Nces Kids: Creating an Area Graph
This is where you will find step by step directions explaining how to create an area graph. Complete each step and click on the next tab. Directions are simple and clear.
PBS
Pbs Learning Media: Graphs, Charts, and Tables: Targeted Math Instruction
At the end of this lesson about graphs, charts, and tables, students will be able to interpret and compare data from graphs (including circle, bar, and line graphs), charts, and tables.
CK-12 Foundation
Ck 12: Statistics: Pie Charts Grade 6
[Free Registration/Login may be required to access all resource tools.] Interpret circle graphs and make predictions based on the displayed data.
Texas A&M University
Wtamu Virtual Math Lab: Beginning Algebra: Reading Graphs
A good introduction to reading bar, line, and double line graphs, and drawing and reading Venn diagrams. Contains definitions and examples of these types of charts and graphs as well as practice exercises that ask you to answer questions...
E-learning for Kids
E Learning for Kids: Math: Movie Theater: Circle Graphs
On this interactive website, students practice interpreting information in circle graphs.
Beacon Learning Center
Beacon Learning Center: Push Ups
This is a tutorial on line graphs including when, how, and why one might choose to use them and how to interpret the data when it is complete. This one is to reach a goal for the number of push ups needed to win the Presidential Fitness...
The Franklin Institute
Frankin Institute Online: Group Graphing
This site from The Franklin Institute explores how to make a simple graph using a spreadsheet to portray survey data. It also gives a set of interesting sports-related web sites so that students can get statistical inforamtion.
ClassFlow
Class Flow: Charts Handling Data
[Free Registration/Login Required] Reading graphs fit together with this engaging, colorful flipchart analyzing pie charts, bar graph, percents, and fractions.


