TeachEngineering
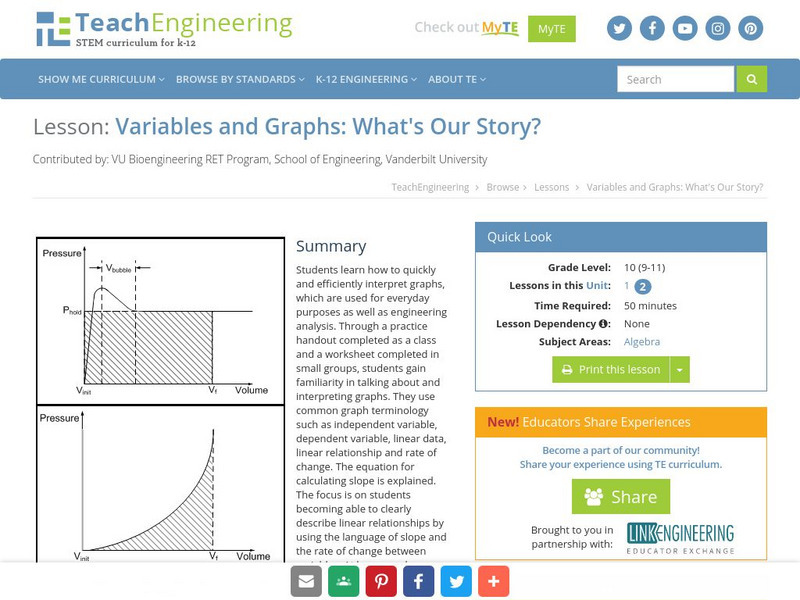
Teach Engineering: Variables and Graphs: What's Our Story?
Students learn how to quickly and efficiently interpret graphs, which are used for everyday purposes as well as engineering analysis.
Primary Resources
Primary Resources: Tally and Bar Charts
Lots of good materials for teaching about tally marks and bar graphs.
Texas Instruments
Texas Instruments: Identifying Qualitative Graphs
In this activity, you will identify the graph that shows the situation described.
Beacon Learning Center
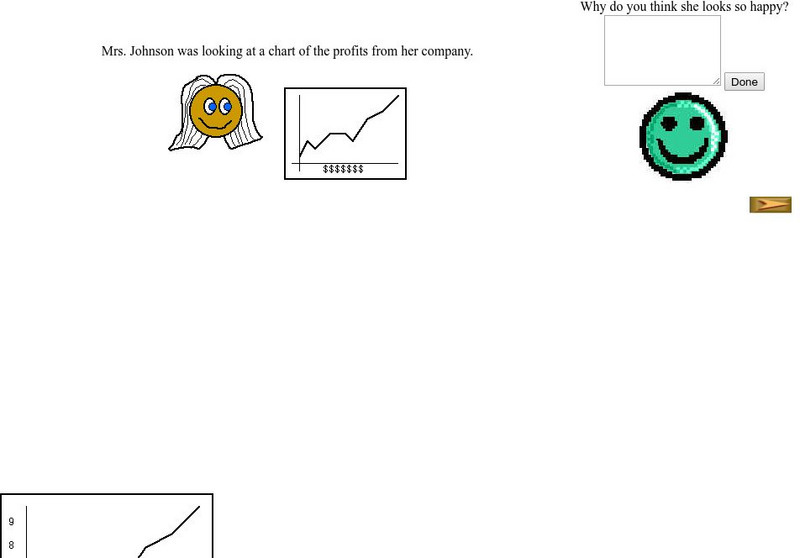
Beacon Learning Center: Interpreting Line Graphs
This site is a lesson on creating and interpreting a line graph. It explains how a line graph is created and then asks questions about what is learned from the data. Students type in open responses, and answers and feedback follow.
Government of Alberta
Learn Alberta: Math Interactives: Exploring Data Display and Graphs
This multimedia Learn Alberta math resource focuses on graphing data. In the video portion, students will see how math is involved in the display of merchandise in stores. The accompanying interactive component provides an exploration...
Texas Education Agency
Texas Gateway: Evaluating Data in Tables, Graphs and Charts
[Accessible by TX Educators. Free Registration/Login Required] In this lesson students look at examples of graphics, tables, charts, and graphs, and learn how to interpret their data. They will be able to use this skill to enhance their...
Texas Education Agency
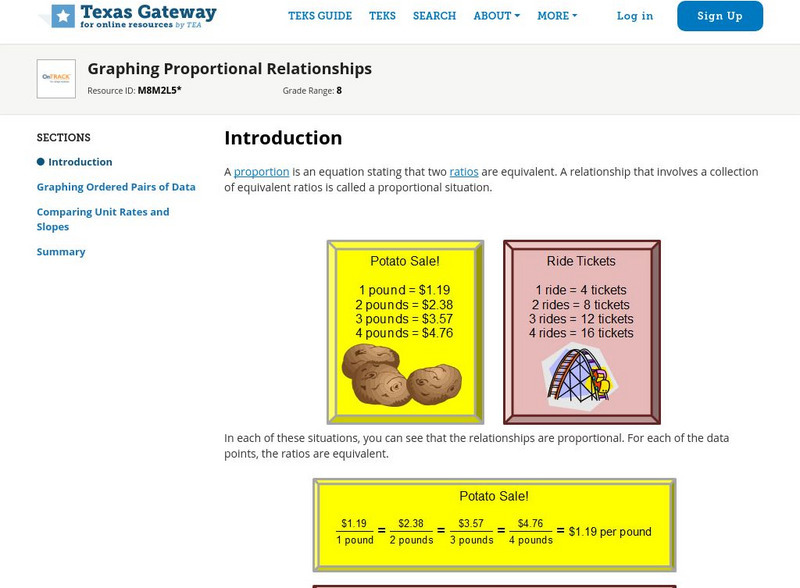
Texas Gateway: Graphing Proportional Relationships
Given a proportional relationship, students will be able to graph a set of data from the relationship and interpret the unit rate as the slope of the line.
Texas Education Agency
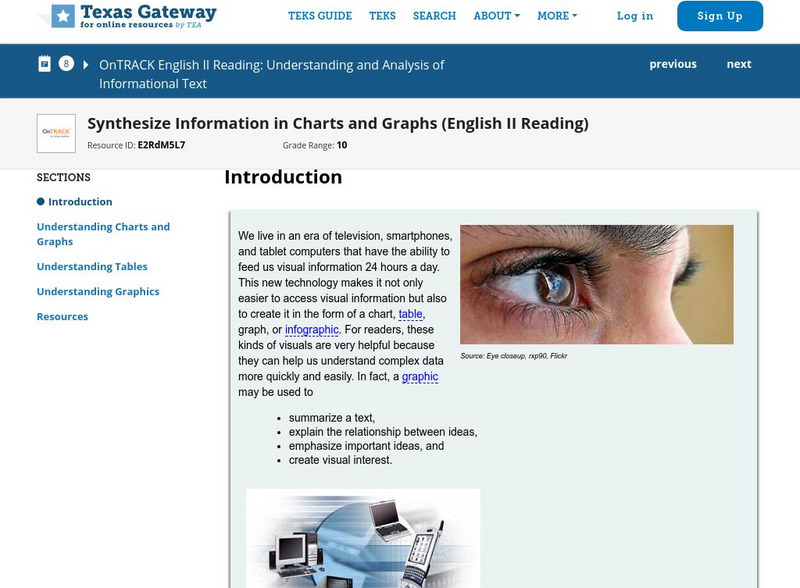
Texas Gateway: Synthesize Information in Charts and Graphs (English Ii Reading)
Synthesize information that you find in charts and graphs.
CK-12 Foundation
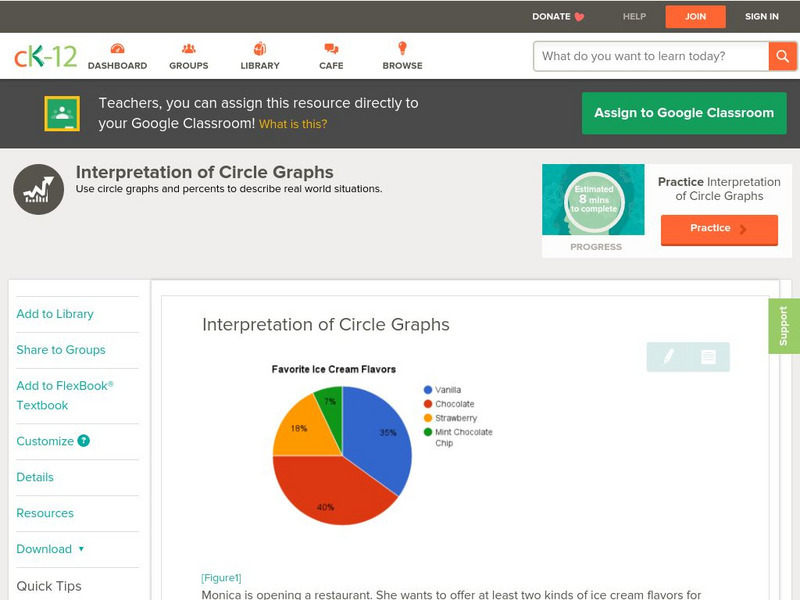
Ck 12: Statistics: Interpretation of Circle Graphs Grades 6 7
[Free Registration/Login may be required to access all resource tools.] Read and interpret circle graphs.
Khan Academy
Khan Academy: Interpreting Graphs of Proportional Relationships
Practice reading and analyzing graphs of proportional relationships. Students receive immediate feedback and have the opportunity to try questions repeatedly, watch a video or receive hints.
CK-12 Foundation
Ck 12: Statistics: Broken Line Graphs
[Free Registration/Login may be required to access all resource tools.] Covers creating and interpreting broken-line graphs.
CK-12 Foundation
Ck 12: Statistics: Double Line Graphs
[Free Registration/Login may be required to access all resource tools.] Construct and interpret double line graphs.
Khan Academy
Khan Academy: Read Picture Graphs (Multi Step Problems)
Interpret picture graphs to answer questions about a context. Students receive immediate feedback and have the opportunity to try questions repeatedly, watch a video or receive hints.
Khan Academy
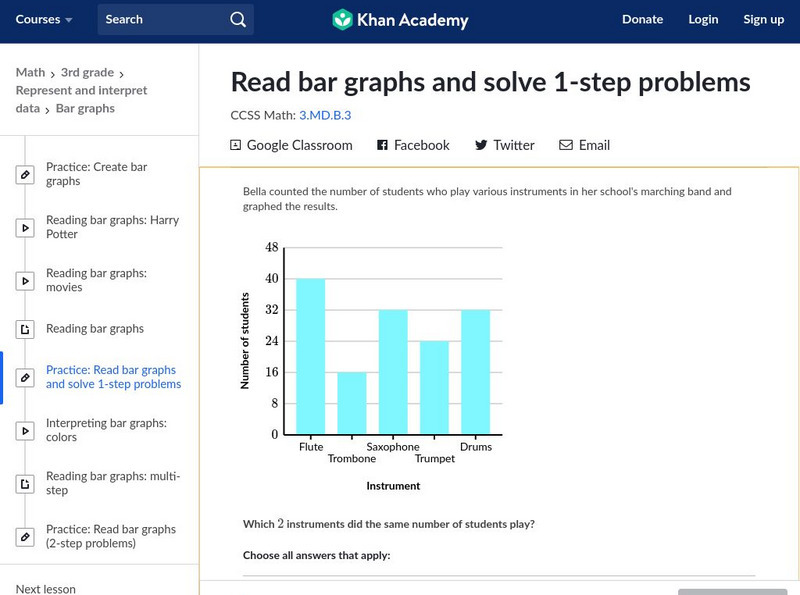
Khan Academy: Read Bar Graphs and Solve 1 Step Problems
Interpret bar graphs to answer questions about a context. Students receive immediate feedback and have the opportunity to try questions repeatedly, watch a video or receive hints.
CK-12 Foundation
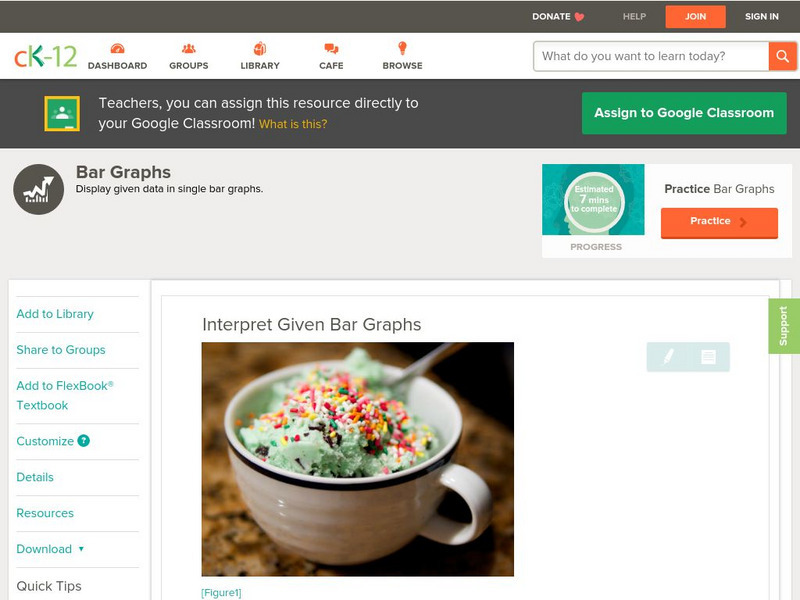
Ck 12: Statistics: Bar Graphs Grade 8
[Free Registration/Login may be required to access all resource tools.] Students will interpret data to understand given bar graphs.
Khan Academy
Khan Academy: Solve Problems With Bar Graphs 1
Read and interpret bar graphs. Students receive immediate feedback and have the opportunity to try questions repeatedly, watch a video or receive hints.
Other
Nearpod: Interpreting Slope & Y Intercept
In this lesson on interpreting slope and y-intercept, 8th graders will learn how to identify the slope and the y-intercept of a line in order to identify if a proportion is demonstrated.
Better Lesson
Better Lesson: Dr. Seuss Graphs Part 1
Favorite Dr. Seuss characters are something that students can collect data on, graph and interpret.
US Department of Education
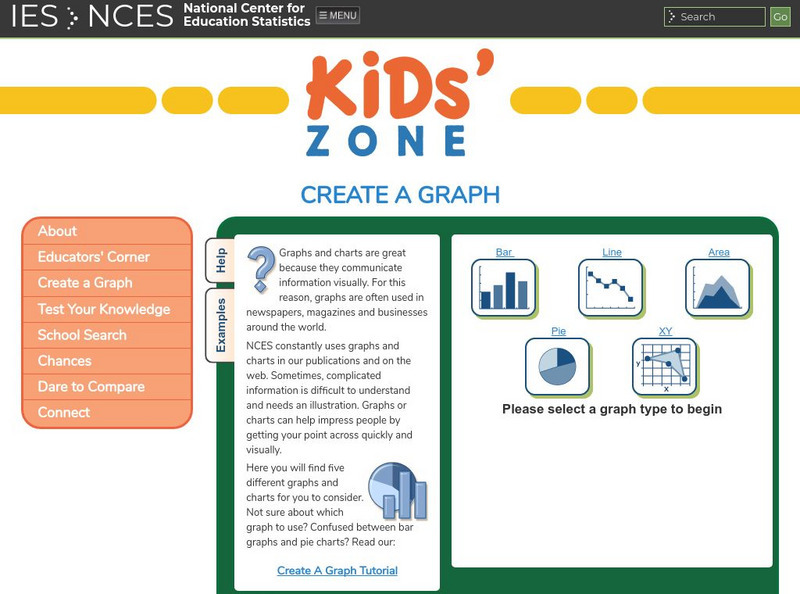
Nces Kids: Create an Xy Graph
This is where you can find a step by step explanation of how to create an XY graph. When you finish each step just click the next tab and you will find the next set of instructions.
Shodor Education Foundation
Shodor Interactivate: Lesson: Reading Graphs
Presents an introductory instructional activity to teach students how to read and plot graphs and determine functions based on graphs.
Integrated Publishing
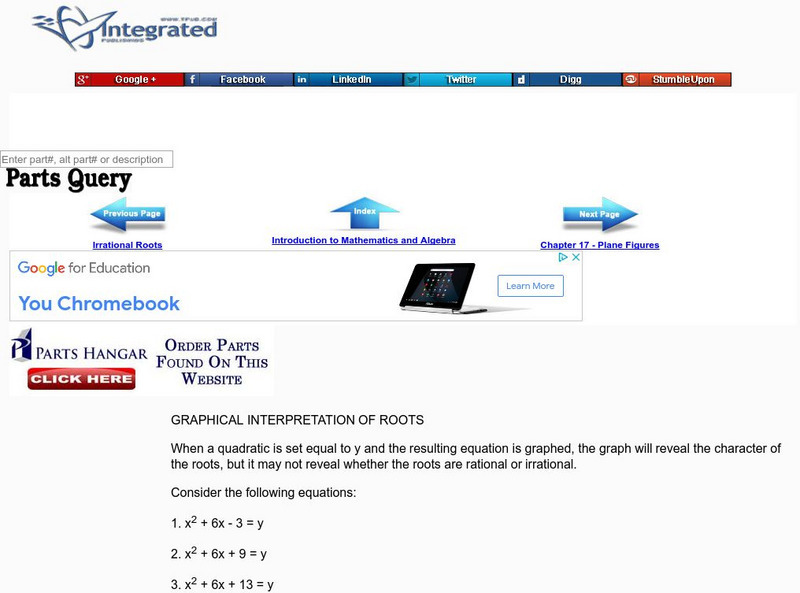
Integrated Publishing: Graphical Interpretation of Roots
This site compares the graphs of three quadratic functions, and explains how certain characteristics of the graph relate to properties of the equations and their solutions. Contains practice problems, including real-world examples.
CK-12 Foundation
Ck 12: Graphing
[Free Registration/Login may be required to access all resource tools.] Given a set of data, students will understand how to correctly draw a line or bar graph, interpret its patterns, and find the slope in the case of a line graph.
Quia
Quia: Reading Charts and Graphs Quiz
This 25-question quiz asks students to read various kinds of charts and graphs and to select the correct answers to the questions. Immediate feedback is provided after each question. Java is required.
Science Education Resource Center at Carleton College
Serc: Investigating Motion Graphing Speed
In this introduction to motion activity, students will get a personal understanding of speed and acceleration by experiencing it firsthand. Wheeled office chairs or other cart like devices are used to give one student a ride as a fellow...
Other popular searches
- Interpret Graphs and Charts
- Read and Interpret Graphs
- Graphs Interpret
- Interpret Graphs Science
- Interpret Graphs and Data
- Use and Interpret Graphs
- Interpret Graphs and Science
- Algebra Interpret Graphs
- Graphs Interpret Plot
