Texas Education Agency
Texas Gateway: Interpreting Graphs
Given a graph, the student will analyze, interpret, and communicate the mathematical relationship represented and its characteristics.
TeachEngineering
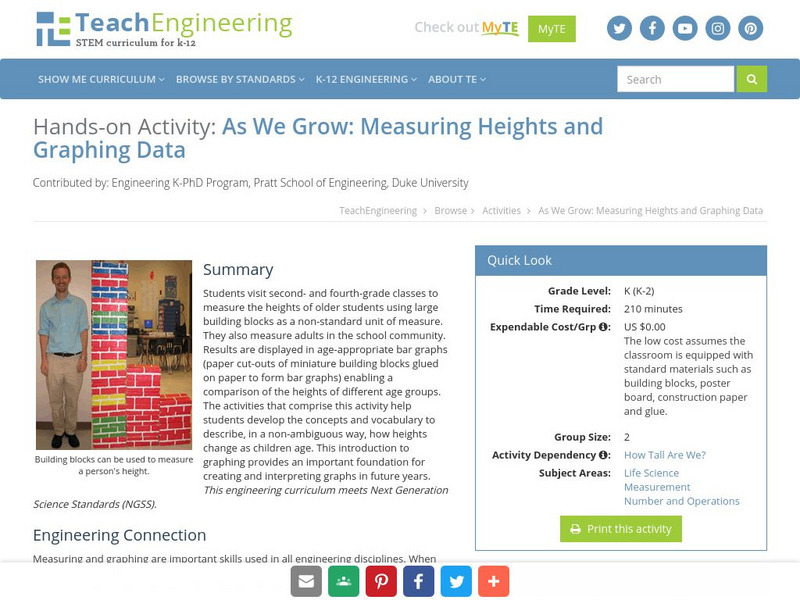
Teach Engineering: Growing and Graphing
Students visit a 2nd and a 4th grade class to measure the heights of older students using large building blocks as a non-standard unit of measure. They can also measure adults in the school community. Results are displayed in...
The Franklin Institute
Frankin Institute Online: Group Graphing
This site from The Franklin Institute explores how to make a simple graph using a spreadsheet to portray survey data. It also gives a set of interesting sports-related web sites so that students can get statistical inforamtion.
E-learning for Kids
E Learning for Kids: Math: Elephant Plant: Data and Graphs
On this interactive website students practice various math skills using a real-life scenario involving plants. Those skills include interpreting data in a circle graph, interpreting data in a divided bar graph, and interpreting a bar...
Illustrative Mathematics
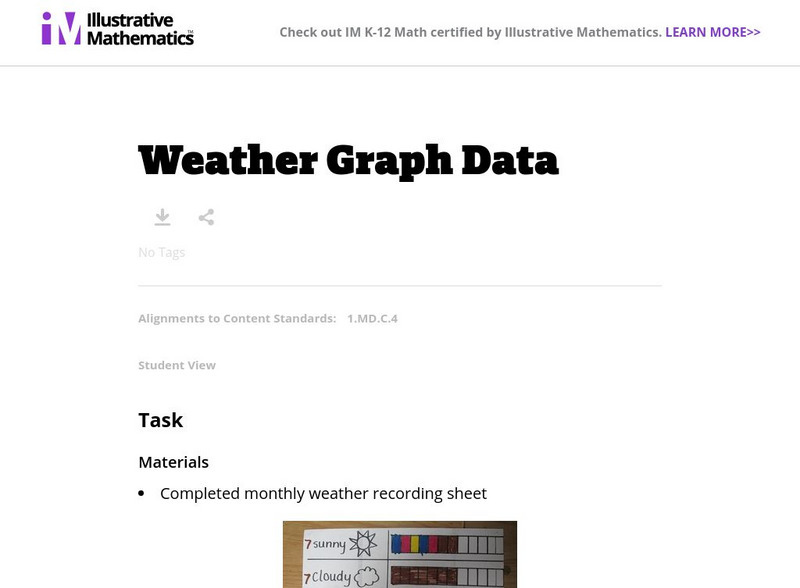
Illustrative Mathematics: Weather Graph Data
The purpose of this task is for students to represent and interpret weather data, as well as answer questions about the data they have recorded. Student worksheets and recording sheet are included.
Other
The Topic: Charts and Graphs
Brief descriptions of charts and graphs, followed by links to larger sites on the same subject.
Concord Consortium
Concord Consortium: Exponential Decay
Learn about exponential decay in real-world situations. Problems involve the application of depreciation of an asset and radioactive decay. Learn to apply exponential decay equations and interpret graphs.
CPALMS
Cpalms: Dollars for Density
This is a guided inquiry activity in which students use simple lab procedures and discussions to develop and apply the concept of density. Students collect and graph data which they use to explore the relationship between mass and...
CK-12 Foundation
Ck 12: Instantaneous Velocity
[Free Registration/Login may be required to access all resource tools.] Students explore instantaneous velocity and how to calculate it. They also learn how interpret and create position vs time graphs.
National Council of Teachers of Mathematics
The Math Forum: Urban Systemic Initiative/oceans of Data
This site includes questions related to reading and understanding graphs. There are links on this site to lesson plans, benchmarks, and other webpages all of which mostly center about probability and statistics.
Illustrative Mathematics
Illustrative Mathematics: 8.f Bike Race
Eighth graders are presented with the distance-time graphs of two bike riders in a race. They are to identify the winner and write a story describing what is happening during the race based on the shapes of the graphs. Aligns with 8.F.B.5.
Illustrative Mathematics
Illustrative Mathematics: 8.f Distance
Eighth graders are presented with the graphs of two cars traveling. One shows distance from home versus time and the other shows speed versus time. Students are to write a description of what might be happening during each car's...
Exploratorium
Exploratorium: Global Climate Change: Research Explorer
Explore scientific data relating to the atmosphere, oceans, areas covered by ice, and living organisms in all these domains. Interpret past and present climate data to predict future climate change and its possible effects.
Illustrative Mathematics
Illustrative Mathematics: Favorite Ice Cream Flavor
The purpose of this task is for students to represent and interpret categorical data. As a class, students will answer a question with three possible answers and construct a bar graph with the responses. Multiple discussion questions and...
Illustrative Mathematics
Illustrative Mathematics: 8.f Riding by the Library
In this task, 8th graders draw the graphs of two functions from verbal descriptions. Both functions describe the same situation but changing the viewpoint of the observer changes where the function has output value zero. This forces the...
Illustrative Mathematics
Illustrative Mathematics: F Le a Saturating Exponential
For this problem, students use an exponential equation to investigate the warming up of a cold beverage on a summer day and analyze a graph to estimate temperatures. Aligns with F-LE.B.5 and F-BF.B.
Shodor Education Foundation
Shodor Interactivate: Derivate
Explores derivatives and the idea of infinity using a geometric interpretation of slope.
PBS
Pbs Learning Media: Everyday Algebra Plus: Targeted Math Instruction
Algebra lesson focuses on using patterns and relationships to write equations with two variables to represent relationships and patterns in real-world problems, plotting ordered pairs on a coordinate grid, and interpreting the meaning of...
Better Lesson
Better Lesson: Algebra Ii: The Trigonometric Functions
A lesson plan where students will interpret the trigonometric functions in terms of the unit circle, graph a sinusoidal function, and use a sinusoidal function to make interpretations in a modeling context.
Howard Hughes Medical Institute
Hhmi: Bio Interactive: Effects of Natural Selection on Finch Beak Size
In this activity, students examine research on finches on the island of Daphne Major in the Galapagos Islands. The depth of the finches' beaks was measured before and after a drought. This data is displayed in graphs and students are...
TeachEngineering
Teach Engineering: How Tall Are We?
Kindergartners measure each other's height using large building blocks, then visit a 2nd and a 4th grade class to measure those students. They can also measure adults in the school community. Results are displayed in age-appropriate bar...
Illustrative Mathematics
Illustrative Mathematics: 8.ee Stuffing Envelopes
Eighth graders are asked to compare the income earned from two summer jobs stuffing envelopes. They are to draw graphs, write equations, and interpret the graphs. This task provides students with an opportunity to take the step from unit...
Illustrative Mathematics
Illustrative Mathematics: F if Which Function?
For this task, students are presented with a graph and asked to identify the functions that could be represented by it and explain their thinking. The task addresses knowledge related to interpreting forms of functions derived by...
Illustrative Mathematics
Illustrative Mathematics: 8.ee Sore Throats, Variation 2
For this task where two saltwater solutions are compared, 8th graders must find equivalent ratios, write an equation that works for both solutions, draw the equation's graph, and interpret the slope as a unit rate. Aligns with 8.EE.B.5.
Other popular searches
- Interpret Graphs and Charts
- Read and Interpret Graphs
- Graphs Interpret
- Interpret Graphs Science
- Interpret Graphs and Data
- Use and Interpret Graphs
- Interpret Graphs and Science
- Algebra Interpret Graphs
- Graphs Interpret Plot
