Texas Education Agency
Texas Gateway: Interpreting Graphs
Given a graph, the student will analyze, interpret, and communicate the mathematical relationship represented and its characteristics.
TeachEngineering
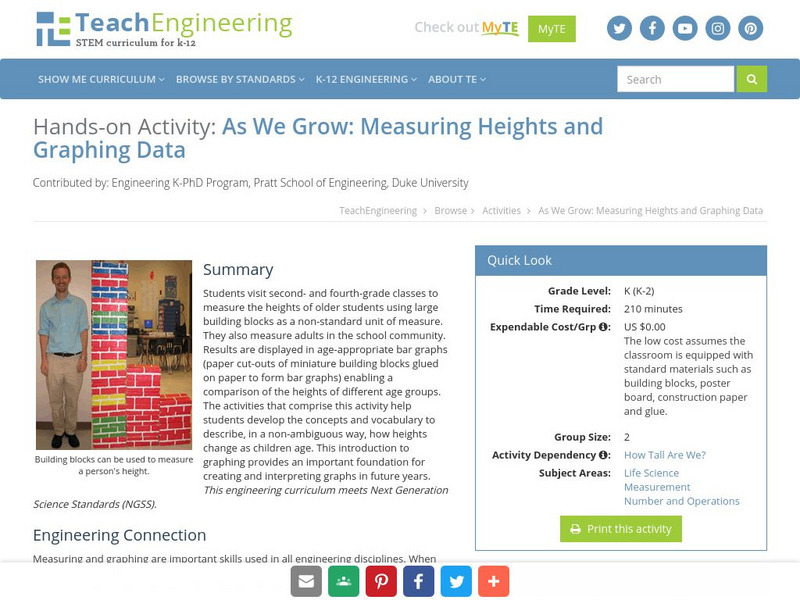
Teach Engineering: Growing and Graphing
Students visit a 2nd and a 4th grade class to measure the heights of older students using large building blocks as a non-standard unit of measure. They can also measure adults in the school community. Results are displayed in...
Illustrative Mathematics
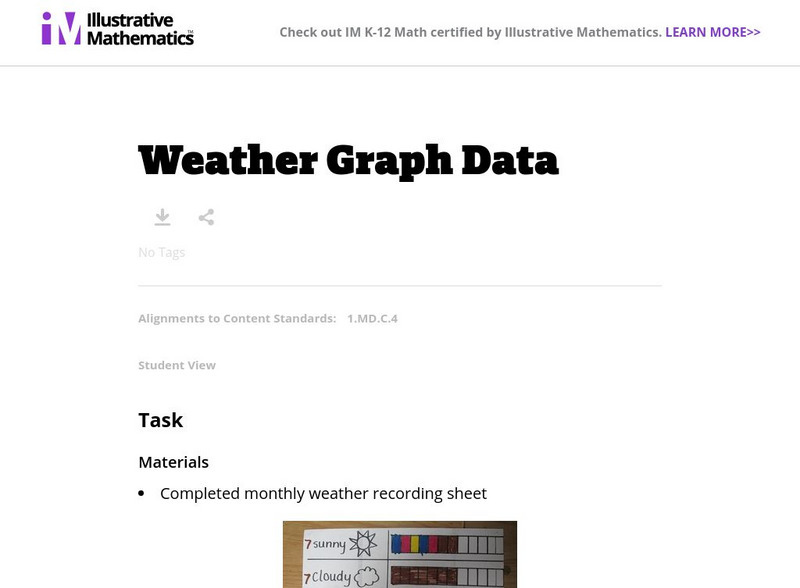
Illustrative Mathematics: Weather Graph Data
The purpose of this task is for students to represent and interpret weather data, as well as answer questions about the data they have recorded. Student worksheets and recording sheet are included.
Khan Academy
Khan Academy: Graph Interpretation Word Problems
Match features of graphs of modeling functions to their real-world meaning. Students receive immediate feedback and have the opportunity to try questions repeatedly, watch a video or receive hints.
Texas Education Agency
Texas Gateway: Predicting, Finding, and Justifying Data From a Graph
Given data in the form of a graph, the student will use the graph to interpret solutions to problems.
Other
The Topic: Charts and Graphs
Brief descriptions of charts and graphs, followed by links to larger sites on the same subject.
Illustrative Mathematics
Illustrative Mathematics: F if Interpreting the Graph
In this task, students are asked to label points on the graph of a function that illustrate several statements. Aligns with F-IF.A.
Science Education Resource Center at Carleton College
Serc: Global Warming Graph Analysis
Students interpret a variety of graphs from Intergovernmental Panel on Climate Change reports learning the details of climate change.
Student Achievement Partners
Illustrative Mathematics: Equations of Lines [Pdf]
In this instructional activity, students are to interpret graphs with equations of lines.
PBS
Wnet: Thirteen: Math in Basketball: Lesson Plan
In this lesson plan, students will explore ways that mathematics are used in basketball. Students will explore the concept of a function and will learn to use function notation. Students will recognize, describe, and represent quadratic...
Texas Education Agency
Texas Gateway: Writing Verbal Descriptions of Functional Relationships
Given a problem situation containing a functional relationship, the student will verbally describe the functional relationship that exists.
US Geological Survey
Lake Pontchartrain Basin Foundation: Resource Management
A variety of activities to show students how population size relates to how land is used in the Lake Pontchartrain Basin. Activities provide opportunities for students to interpret graphs, read maps, research problems, defend a side, and...
CK-12 Foundation
Ck 12: Algebra Ii: 3.11 Modeling With Exponential Decay and Log Functions
This lesson continues exploring the process for modeling real world scenarios by writing and solving exponential and logarithmic functions. It also covers how to create and interpret graphs of such functions.
Illustrative Mathematics
Illustrative Mathematics: 8.f Chicken and Steak, Variation 1
This task has students find a linear function that will calculate the amount of chicken and steak to purchase in order to stay within a given budget. Students then graph the function and interpret it. Aligns with 8.F.B.4.
Illustrative Mathematics
Illustrative Mathematics: F if How Is the Weather?
For this task, students are presented with three graphs that show solar radiation as a function of time. They are asked to match each graph to the corresponding description of the weather during the day. Aligns with F-IF.B.4.
Illustrative Mathematics
Illustrative Mathematics: 8.f Bike Race
Eighth graders are presented with the distance-time graphs of two bike riders in a race. They are to identify the winner and write a story describing what is happening during the race based on the shapes of the graphs. Aligns with 8.F.B.5.
Illustrative Mathematics
Illustrative Mathematics: F if Logistic Growth Model, Abstract Version
For this task, students are presented with an equation for a logistic growth model and are asked to analyze it. They are then questioned about a graph showing bacterial population growth. Next, they must use information from earlier...
Illustrative Mathematics
Illustrative Mathematics: F If.6 Mathemafish Population
For this task, students are presented with a table and a graph and are asked to summarize the data and report the findings of a project by the Environmental Protection Agency to contain the effects of an invasive species on a fish...
Illustrative Mathematics
Illustrative Mathematics: 8.f Riding by the Library
In this task, 8th graders draw the graphs of two functions from verbal descriptions. Both functions describe the same situation but changing the viewpoint of the observer changes where the function has output value zero. This forces the...
Other
Stat Trek: Data Patterns in Statistics
This lesson looks at how to recognize patterns in a data display by examining the shape of a graph, the center, the spread, and unusual features such as outliers. Includes video. [11:16]
Better Lesson
Better Lesson: Algebra Ii: The Trigonometric Functions
A lesson plan where students will interpret the trigonometric functions in terms of the unit circle, graph a sinusoidal function, and use a sinusoidal function to make interpretations in a modeling context.
Texas Education Agency
Texas Gateway: Ap Physics: 2.3 Time, Velocity, and Speed
By the end of this section, you will be able to do the following: Explain the relationships between instantaneous velocity, average velocity, instantaneous speed, average speed, displacement, and time; Calculate velocity and speed given...
Howard Hughes Medical Institute
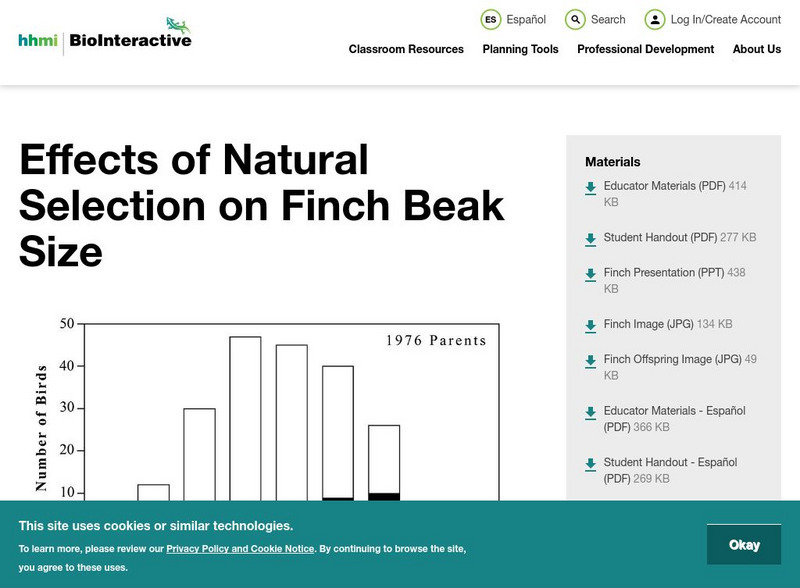
Hhmi: Bio Interactive: Effects of Natural Selection on Finch Beak Size
In this activity, students examine research on finches on the island of Daphne Major in the Galapagos Islands. The depth of the finches' beaks was measured before and after a drought. This data is displayed in graphs and students are...
University Corporation for Atmospheric Research
Ucar: The Sun Earth Connection: Sunspots and Climate
Through graphing data and interpretation, students learn about sunspots and their effect on the climate of our planet.
Other popular searches
- Interpret Graphs and Charts
- Read and Interpret Graphs
- Graphs Interpret
- Interpret Graphs Science
- Interpret Graphs and Data
- Use and Interpret Graphs
- Interpret Graphs and Science
- Algebra Interpret Graphs
- Graphs Interpret Plot
