Curated OER
Graphing Data
First graders learn how to display data using a bar graph. In this bar graph lesson plan, 1st graders use data from a t-shirt color survey to make a bar graph. They also make an animal bar graph before interpreting the information.
Curated OER
Temperature Bar Graph
Students explore mean, median and mode. In this math lesson, students analyze temperature data and figure the mean, median, and mode of the data. Students graph the data in a bar graph.
Curated OER
Reading Graphs
Students practice plotting functions on the Cartesian coordinate plane, see several categories of functions, including lines and parabolas, and read a graph, answering questions about the situation described by the graph
Curated OER
Organizing Data Using Tables and Graphs
Learners create graphs and tables, as well as interpret and make inferences from the data shown to determine when and where graphs and tables are most useful.
Curated OER
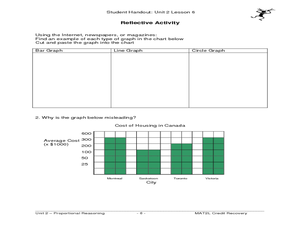
The Circle Graph
For this circle graph worksheet, students complete problems involving many circle graphs including a compass rose, degrees, and more. Students complete 7 activities.
Curated OER
Histograms and Bar Graphs
Learners are introduced to histograms, bar graphs, and the concept of class interval. They use an activity and three discussions with supplemental exercises to help students explore how data can be graphically represented (and...
Curated OER
Bar Charts and Pictographs: How can they help us?
First graders work with manipulatives to solve various math problems by using concrete objects to solve a list of problems . They create and evaluate bar graphs and write a statement about the information on their bar graph.
Curated OER
Free Fall Graphing Exercise
Twelfth graders practice their graphing skills in an exercise about acceleration due to gravity. Lesson opens with a demonstration of acceleration due to gravity and a brief discussion. Students complete a worksheet and go over answers...
Curated OER
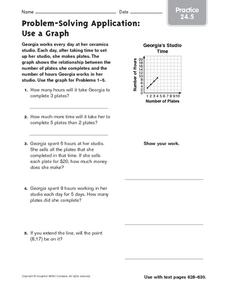
Problem-Solving Application: Use a Graph: Practice
In this graphing coordinates instructional activity, students study the graph and the coordinates. Students then answer the five questions about the graph and show their work.
Curated OER
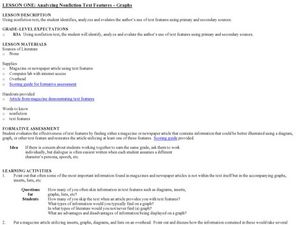
Analyzing Non-Fiction Text Features- Graphs
Students examine the text features of non-fiction. For this literacy lesson, students practice reading graphs and discover the authors intent for using them in primary and secondary sources.
Curated OER
Problem Solving: Use a Graph 3
For this math problem solving worksheet, learners examine a graph based on books read and use it to solve 2 problem solving questions and a test prep question.
Curated OER
Analyzing Nonfiction Text Features - Graphs
Students examine the text features of non-fiction. In this literacy instructional activity, students practice reading graphs and discover the authors intent for using them in primary and secondary sources.
Curated OER
Line Graphs 4
In this graph worksheet, students interpret given line graphs. They determine the range, and identify the range in a set of data. This one-page worksheet contains approximately 14 problems.
Curated OER
Bar Graphs with Tally Marks
Students classify buttons into categories, create and interpret a tally table and bar graph, and add and subtract numbers.
Curated OER
Analyze and Interpret Statistical Information
In this probability and statistics worksheet, 9th graders analyze and interpret histograms as they identify trends in the data. The two page worksheet contains four problems. Answers are provided.
Curated OER
Graphs, Equations and Inequalities
In this graphs, equations and inequalities worksheet, students graph inequalities. They read graphs and interpret them. Students draw curves with equations. This 12 page worksheet contains approximately 70...
Curated OER
Read the Table Graph
For this reading the table graph worksheet, students read the graph and answer questions. In this short answer worksheet, students write answers to four questions.
Curated OER
Box and Whiskers
Middle schoolers discover how to relate collected data with a box and whiskers graph in a number of formats. They collect, organize, create, and interpret a box and whiskers graph. Pupils interpret the difference between sets of data,...
Curated OER
What's Data?
Students get the opportunity to investigate the concept of data collecting. They explore how to tally and read a bar graph. Vocabulary about data is also be included. At the end of the lesson, individual students collect data independently.
Curated OER
Choose The Appropriate Graph
Fifth graders work in groups to investigate the proper use of a graph during a schoolyard ecology project. The challenge of the project is for students to choose the proper form of a graph. They gather data and conduct analysis with the...
Curated OER
Interpreting Data from Birdfeeders
What kinds of birds live in your area? Read a book about birds to your learners and explore their feeding patterns. Charts and graphs are provided in this three page packet, but consider assigning the basic questions if using with young...
Curated OER
Fire!, Probability, and Chaos
Upper elementary and middle schoolers work with the concept of probability. They are introduced to the concept of chaos. Learners graph and analyze using a line plot, work with mean, and are introduced to the concept of variance.
Curated OER
Statistics of Mars
Students explore the concept of central tendencies. In this central tendencies lesson plan, students sort M&M's or Skittles based on color. Students graph their results. Students find the mean, median, and mode of their data.
Curated OER
The Gathering and Analysis of Data
Young mathematicians gather data on a topic, graph it in various forms, interpret the information, and write a summary of the data. They present their data and graphs to the class.
Other popular searches
- Interpret Graphs and Charts
- Read and Interpret Graphs
- Graphs Interpret
- Interpret Graphs Science
- Interpret Graphs and Data
- Use and Interpret Graphs
- Interpret Graphs and Science
- Algebra Interpret Graphs
- Graphs Interpret Plot


