Curated OER
Playing with Money (From the Other Point of View)
Pupils explore exchange rates. They identify the units of currency of a number of countries. Students convert money amounts accurately. They graph currency fluctuations and interpret graphs.
Curated OER
Understanding Statistics
In this statistics worksheet, students examine and interpret pictographs and line graphs. Students analyze the provided data in order to create bar graphs, circle graphs, and box and whisker plots. The nine page worksheet accompanies a...
Curated OER
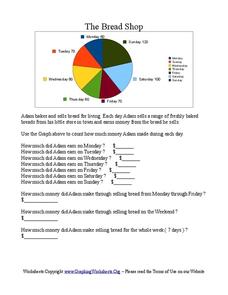
The Bread Shop
In this pie chart activity, students use the pie chart graph to count the money Adam made in the Bread Shop. Students complete 10 questions.
Curated OER
Cindy and Linda Selling Lemonade
For this graphing worksheet, students read a graph, complete a chart about the information, and answer questions. There are fifteen questions in all.
Curated OER
Student Graph for the Mixed-Up Chameleon
In these graphing worksheets, students ask their classmates which animal they would like to be. Students then tally their numbers and graph the data.
Curated OER
Hurricanes in History:
Students interpret data displayed in a graph, make inferences based on graphical data. They work in pairs or groups to interpret graphs containing historical data of hurricanes, and then answer questions that assess their understanding...
Curated OER
How Texas is Planning To Manage Its Water
Students research water management strategies in Texas. They analyze projected demand for water in the year 2050, interpret graphs and tables and then discuss the data as part of a written report. They research and map the locations of...
Curated OER
Analyzing Graphs
In this statistics and probability worksheet, students analyze frequency distribution tables or histograms and box and whisker plots. The two page worksheet contains four multiple choice questions. Answers are included.
Curated OER
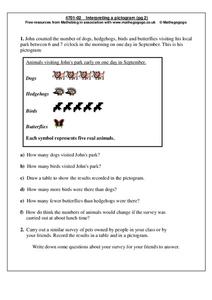
Interpreting a Pictogram
In this pictogram worksheet, students read and analyze a pictogram about dogs, hedgehogs, birds and butterflies and then answer 6 short answer questions. Students conduct a similar survey on pets owned by their friends and put their...
Curated OER
Climate change in Canada
Students investigate the impact of human activity on the environment. In this secondary math/science lesson, students analyze and interpret information from data and graphs as they investigate trends in climate change and the...
Curated OER
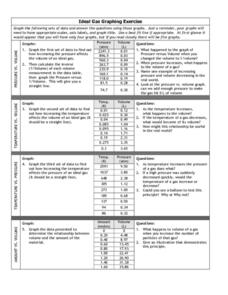
Graphing Exercise of Ideal Gas Data
For this graphing of Ideal Gas Data worksheet, students use the given data to draw 4 graphs of the given data. They are given the pressure and volume to draw and interpret the graphs.
Curated OER
Tracking Olympic Gold!
Students use print or online resources to track the results of the Olympic Games, record daily results on graphs, use graphs to collect information.
Curated OER
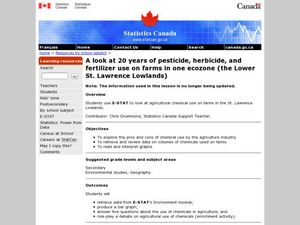
Effects of chemical use in Agriculture
Students research environmental data to create a bar graph. In this agricultural ecology instructional activity, students research the pros and cons of chemical use in farming. Students debate on passing a law to reduce chemical use.
Curated OER
Rainbows, Bridges & Weather, Oh My!
Explore how real-world applications can be parabolic in nature and how to find quadratic functions that best fit data. A number of different examples of modeling parabolas are explored including a student scavenger hunt, the exploration...
Curated OER
Is there Treasure in Trash?
More people, more garbage! Young environmentalists graph population growth against the amount of garbage generated per year and find a linear model that best fits the data. This is an older resource that could benefit from more recent...
Georgia Department of Education
The Basketball Star
Have learners use math to prove they are sports stars! Assess a pupil's ability to create and analyze data using a variety of graphs. The class will be motivated by the association of math and basketball data.
Curated OER
Scatter Plot Basketball
Learners take turns shooting baskets and creating scatterplots based on the data. They create two graphs and look for possible correlation in the data for each graph.
Curated OER
What's Your Average? What Do You Mean? I'm More Than Just Average
Upper grade and middle schoolers collect data, analyze and interpret the data. This three-part lesson should provide learners with a firm understanding about the differences between mean, median, and mode and how to perform the...
Curated OER
A Picture's Worth 1000 Words: Decoding Intercultural Symbols
Learners interpret a set of pictographs, defining what each image means and create their own set of symbols as an alphabet. They then write using their own symbolic alphabet using pictures.
Virginia Department of Education
Analyzing and Interpreting Statistics
Use measures of variance to compare and analyze data sets. Pupils match histograms of data sets to their respective statistical measures. They then use calculated statistics to further analyze groups of data and use the results to make...
Intel
What Does This Graph Tell You?
What can math say about natural phenomena? The fifth STEM lesson in this project-based learning series asks collaborative groups to choose a phenomenon of interest and design an experiment to simulate the phenomenon. After collecting...
Mathed Up!
Pictograms
Young mathematicians read, interpret, and complete a variety of real-world pictograms. Each question includes a key and information to complete the graphs.
Benjamin Franklin High School
Saxon Math: Algebra 2 (Section 9)
Section 9 of the 12 linked Saxon Math sections introduces the young algebrist to graphing periodic functions, creating graphs from quadratic roots, working with inequalities, and rational equations. Common among all the lessons is the...
Radford University
Linear Equations in Real Word Problems
Make up a story about a linear graph. Scholars identify key features of a linear graph, such as intercepts, domain and range, and slope. They then create a word problem that could be represented by the graphed line.
Other popular searches
- Interpret Graphs and Charts
- Read and Interpret Graphs
- Graphs Interpret
- Interpret Graphs Science
- Interpret Graphs and Data
- Use and Interpret Graphs
- Interpret Graphs and Science
- Algebra Interpret Graphs
- Graphs Interpret Plot


