Curated OER
My Test Book: Stem and Leaf Plots
In this math skills learning exercise, students solve 10 multiple choice math problems which require they interpret a stem and leaf plot. Students may view the correct answers.
Curated OER
Getting A Grip On Graphs
Fourth graders investigate the concept of graphing and comparing different types of data using pictographs, line graphs, scatter plots, etc... They gather data and make interpretations while examining the medium of how it is displayed.
Curated OER
Graphing Data from the Chemistry Laboratory
Young scholars graph and analyze data using a spreadsheet.
Curated OER
Graphing Real World Situations
Students solve linear equations using graphs. In this algebra lesson, students depict real life situation using lines and functions. They identify the slope, data and predict graphing behavior.
Curated OER
Graphing Square Root and Other Radical Functions
For this worksheet, students graph the square root and other radical functions by examining the parent function and the translations and shifts that occur within the function family. The two page worksheet contains twelve problems.
Curated OER
Growing and Graphing
Students visit a 2nd and a 4th grade class to measure the heights of older students using large building blocks as a non-standard unit of measure. They can also measure adults in the school community. Results are displayed in...
Alabama Learning Exchange
We Love to Graph!
Students experience graphing points. For this graphing points lesson, students play an on-line game where they must name 10 coordinate pairs correctly. Students play a maze game where they maneuver a robot using coordinate...
Curated OER
Graphing and the Coordinate Plane
Students gain practice reading coordinates and plotting points by participating in the Coordinates! Game. They demonstrate and test their skills with graph paper and the Maze Game.
Curated OER
Review For Test 3
In this test worksheet, students interpret circle graphs, bar graphs, and line graphs. They match graphs to their appropriate linear equation. Students determine the slope of a line. There are 20 problems on this six page worksheet. ...
Curated OER
Generating Points and Graphing
Students create a table of values to help them plot. For this algebra lesson, students plot their points on a coordinate plane creating a graph. They observe and analyze linear functions.
Curated OER
INTERPRETING MAGNETIC FIELD MAPS
High schoolers interpret magnetic field maps, rotate the coordinates to obtain different views, change the coordinate representation, and produce alternate graphical representations.
Curated OER
Histograms: Practice
In this histograms worksheet, students use the bar graph histogram to answer questions 1-4 and the tally chart for question 5. Students finish with two test prep questions.
Curated OER
Linear Equations and Their Graphs
In this Algebra I/Algebra II worksheet, students solve problems involving interpreting the slope of a linear equation as a rate of change. The two page worksheet contains a combination of seven multiple choice and free response...
Curated OER
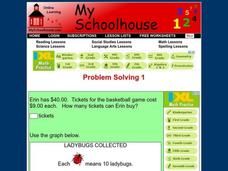
Problem Solving 1
For this online interactive problem solving worksheet, students read a graph and use their problem solving skills in order to respond to 10 questions.
Curated OER
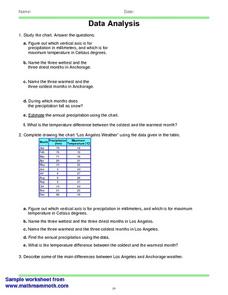
Data Analysis 2
In this data analysis worksheet, students read and interpret given line graphs. They determine the range and average. This one-page worksheet contains five problems.
Curated OER
Birth and Death Rates in European countries
Students discover the world as a global community and the social implications. They construct graphs to represent data, interpret diagrams and draw inferences.Students create a report, which could lead to a class discussion.
Curated OER
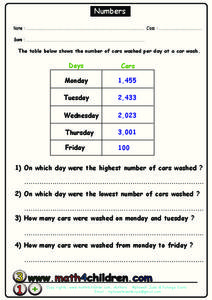
Numbers
In this comparing numbers worksheet, students read the graph that shows the number of cars washed per day at a car wash. Students then compare the numbers by answer the questions.
Curated OER
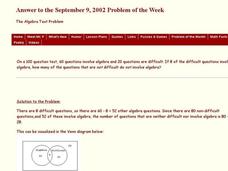
The Algebra Test Problem
In this algebra test worksheet, students construct and interpret a Venn Diagram. They determine the type of algebra problems designated in the Venn Diagram. This one-page worksheet contains 1 problem. The answer is...
Curated OER
High School Mathematics Problems from Alaska: Reading a Graph: Azimuth Range vs. Day in Barrow, Alaska
Students focus on reading and interpreting information from a graph.
Curated OER
Graphing Favorite Colors
Third graders collect data and insert it into ClarisWorks to create a spreadsheet/graph of their favorite color. They interpret the data together.
Curated OER
3-D Beginning Graphs
Students explore the concept of big and small. They collect objects from the classroom, sort them by size, and create a graph using Duplo stacking blocks.
Curated OER
Temperature and the Earth's Atmosphere
Earth science super stars visit the National Earth Science Teachers Association's interactive website to glean information on the layers of the atmosphere. Data tables are provided for them to record what is collected. This assignment...
Curated OER
Button Bonanza
Collections of data represented in stem and leaf plots are organized by young statisticians as they embark some math engaging activities.
Other popular searches
- Interpret Graphs and Charts
- Read and Interpret Graphs
- Graphs Interpret
- Interpret Graphs Science
- Interpret Graphs and Data
- Use and Interpret Graphs
- Interpret Graphs and Science
- Algebra Interpret Graphs
- Graphs Interpret Plot


