Serendip
Changing Biological Communities – Disturbance and Succession
After cutting down a forest to make a farm, how long would it take the environment to turn an abandoned farm back into a forest? Scholars study this exact scenario while they interpret many charts and graphs of the changing ecosystems as...
New York City Department of Education
Grade 5 Literacy in Science: Ecosytems
How do humans affect ecosystems? Learners read two articles and interpret a graph to develop essays on the human impact on ecosystems. They read about human impact on tigers and manatees as a basis for their overarching papers.
CK-12 Foundation
Flashlight
In a simple circuit, does electricity start instantly? A simulation encourages thinking about the flow of electrons at a microscopic level. Pupils control the voltage, resistance, and switch in order to observe the change in both ideal...
CK-12 Foundation
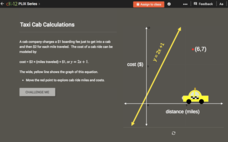
Checking Solutions to Equations: Taxi Cab Calculations
Ride to success in checking solutions to equations. Scholars use an interactive graph to identify points that are solutions to a linear equation. Interpreting these points in terms of the context completes the activity.
PBS
Analyzing Light Curves of Transiting Exoplanets
Scientists detected exoplanets by measuring how the brightness of stars changed over time. Young astronomers interpret and analyze the same data that led to exoplanet discoveries. They learn to apply light curve graphs and connect the...
Howard Hughes Medical Institute
Got Lactase? Blood Glucose Data Analysis
Many physicals include a blood glucose test, but what are doctors actually testing? Scholars graph and interpret blood glucose data, allowing them to observe the differences in lactase persistence and draw conclusions. They then connect...
Utah Education Network (UEN)
Utah Open Textbook: Physics
Textbooks come in all shapes, sizes, and media these days. An electronic textbook resource offers Physics materials for an entire course. The text offers an explanation of physics topics as well as examples of calculations and reading...
Mathalicious
Out of Left Field
A baseball trajectory and a parabola seem to make the best pair in real-world quadratic applications. Here is a current baseball resource with questions, discussions, and explorations regarding a quadratic function and home run...
Curated OER
Mystery Liquids: Linear Function
High schoolers determine the linear equations of the density of water and oil by collecting data on the mass of various volumes of each liquid. They construct scatter plots from the data and use these to write the linear equations for...
Curated OER
Ornithology and Real World Science
Double click that mouse because you just found an amazing lesson! This cross-curricular Ornithology lesson incorporates literature, writing, reading informational text, data collection, scientific inquiry, Internet research, art, and...
Curated OER
Fish Communities in the Hudson
Learning to read data tables is an important skill. Use this resource for your third, fourth, or fifth graders. Learners will will study tables of fish collection data to draw conclusions. The data is based on fish environments in the...
Curated OER
"Data Dabble"
Students engage in a lesson which facilitates their use of web sites to find data, graph it, and interpret it, thus scaffolding graphing skills to prepare students for their 8th grade I-search exit project.
Illustrative Mathematics
Warming and Cooling
Is it too hot to go hiking? This task asks learners to refer to a graph that shows temperature as a function of time and answer five questions about the scenario depicted by the graph. The exercise could be used for instruction to help...
Curated OER
Creating Climographs
Students chart statistical information on graphs, interpret the information and use it to explain spatial relationships, and identify the relationship between climate and vegetation.
Curated OER
How's The Weather?
Students make a box and whiskers plot using the TI-73 graphing calculator. Each student would have their own calculator but they would work in small groups of two or three to help each other enter the data and make the plots.
Curated OER
Mapping Ancient Coastlines
Most of this instructional activity is spent working on the "Bathymetry Worksheet." It includes a graph of the changes in sea level over the past 150,000 years and a bathymetric map of changes in an imaginary coastline over time....
Curated OER
Height versus Shoe Size
Students find a correlation between a person's height and his/her shoe size. They have access to entering data into lists on a graphing calculator and can complete scatter plots. Students read and interpret a scatter plot and use the...
Curated OER
Virtual Field Trip
This hands-on resource has future trip planners analyze graphs of mileage, gasoline costs, and travel time on different routes. While this was originally designed for a problem-solving exercise using a Michigan map, it could be used as a...
Illustrative Mathematics
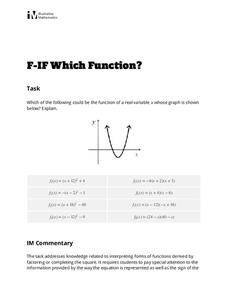
Which Function?
Learners are given a graph of a parabola on a coordinate system, but intercepts and vertex are not labeled. The task is to analyze eight given quadratic functions and determine which ones might possibly be represented by the graph. The...
Curated OER
Linear Inequalities in Two Variables
Use this worksheet as a warm up, a refresher exercise, or a practice after a more detailed lesson on graphing linear inequalities in two variables. Start with boundaries that are horizontal or vertical, then move into graphs with...
Curated OER
Finding Equations
Students make equations from everyday data. They create a graph from the equations. Students predict and analyze the results. Students complete the second scenario on their own and turn in their handout.
Curated OER
WHAT IS THE POPULAR COLOR?
Fourth graders graph cars according to their colors. They complete the graph including a title, scale, x-axis, and y-axis. Students collect the data and choose the type of graph to be made.
Curated OER
Bisphenol A and Diabetes
Pupils summarize the data that is displayed and examine how bisphenol A behaves and how it contributes to diabetes. Learners also study an article and interpret line graphs.
Curated OER
Representation of Quadratic Functions
Students use a table, graph or equation to represent a quadratic function. In this algebra instructional activity, students model and graph with quadratic function. They become comfortable representing quadratics using...
Other popular searches
- Interpret Graphs and Charts
- Read and Interpret Graphs
- Graphs Interpret
- Interpret Graphs Science
- Interpret Graphs and Data
- Use and Interpret Graphs
- Interpret Graphs and Science
- Algebra Interpret Graphs
- Graphs Interpret Plot

