The Franklin Institute
Frankin Institute Online: Group Graphing
This site from The Franklin Institute explores how to make a simple graph using a spreadsheet to portray survey data. It also gives a set of interesting sports-related web sites so that students can get statistical inforamtion.
E-learning for Kids
E Learning for Kids: Math: Elephant Plant: Data and Graphs
On this interactive website students practice various math skills using a real-life scenario involving plants. Those skills include interpreting data in a circle graph, interpreting data in a divided bar graph, and interpreting a bar...
Missouri State University
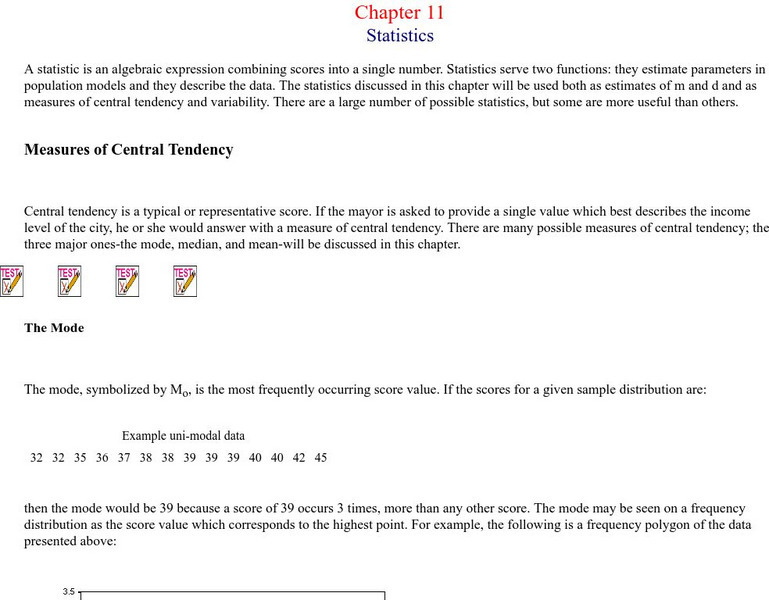
Missouri State University: Introductory Statistics: Statistics
This is an excellent resource on what the science of statistics involves. There are all kinds of definitions, examples, graphs, and charts to learn from. The topics covered include: mode, mean, median, skewed distributions and measures...
PBS
Pbs Learning Media: Everyday Algebra Plus: Targeted Math Instruction
Algebra lesson focuses on using patterns and relationships to write equations with two variables to represent relationships and patterns in real-world problems, plotting ordered pairs on a coordinate grid, and interpreting the meaning of...
Council for Economic Education
Econ Ed Link: The Economics of Homebuying
This lesson analyzes the costs and benefits of homeownership and asks the student to describe the factors that affect affordability, use cost-benefit analysis and knowledge of home-buying procedures to reduce the costs, analyze the...


