Curated OER
Regents High School Examination PHYSICAL SETTING CHEMISTRY 2007
The University of the State of New York has designed a series of exams to be given to high schoolers. This chemistry exam is one of the most comprehensive and well-written that you will ever find. It consists of 84 questions in a variety...
Curated OER
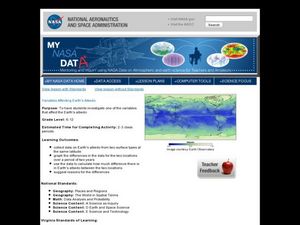
Variables Affecting Earth's Albedo
Students study the variables that affect the Earth's albedo. In this environmental data analysis lesson students interpret and graph information and calculate changes.
Curated OER
Population Ecology
A complete study of population ecology is covered by this worksheet. Biology or ecology learners answer questions and interpret population graphs. This can be used as the intended guided notes worksheet or assigned as homework.
Curated OER
Enzymes at Work
The first four questions on this assignment require the use of critical thinking skills to apply the action of enzymes to different situations. Biologists then interpret enzyme activity data in a table and answer questions about it. This...
Curated OER
Settlement Exploration: Then and Now
NASA has crafted an imaginative and memorable series of lessons, "NASA and Jamestown Education Module." This lesson is one of the five components. In it, middle schoolers connect history and science by comparing the settlement of...
Curated OER
Temperature and the Earth's Atmosphere
Earth science super stars visit the National Earth Science Teachers Association's interactive website to glean information on the layers of the atmosphere. Data tables are provided for them to record what is collected. This assignment...
University of Georgia
Splat!
What does viscosity have to do with splatter? An activity shows that the viscosity of a substance is inversely proportional to the distance of its splatter. Learners conduct the experiment by collecting data, graphing, and analyzing...
Curated OER
Peer Review Form for Scientific Writing
A peer review form just for science? Specifically tailored for science writing, this resource asks editors to give detailed responses to questions about the relevance of the study, the clarity of the hypotheses, the methods, materials,...
Curated OER
How Texas is Planning To Manage Its Water
Students research water management strategies in Texas. They analyze projected demand for water in the year 2050, interpret graphs and tables and then discuss the data as part of a written report. They research and map the locations of...
Curated OER
Bycatch
Bycatch is the unwanted and discarded marine life caught during commercial fishing. Young marine scientists review bycatch litigation and analyze graphs of bycatch data and answer questions about it. This raises awareness while...
Curated OER
Ball Bounce Experiment
Young scholars investigate different balls' abilities to bounce. They conduct a Ball Bounce Height Comparison and Ball Bounce Time Comparison, complete a worksheet, graph the results of their experiment, and answer investigating questions.
Curated OER
Mathematics in Bioengineering: Its Application for Today's Students
High schoolers explore the different fields of bioengineering. They will create and interpret graphs from cancel cells data. They then calculate the amount of drugs found in blood and eliminated by the body over time.
Curated OER
Earth Energy Budget Pre Lab
Learners explore energy by conducting an in class experiment. In this climate change instructional activity, students conduct a water vapor experiment in a soda bottle. Learners utilize graphs and charts to analyze the results of the...
Curated OER
Linear Motion 5
In this linear motion worksheet, students answer 9 questions about velocity, acceleration and position of objects. They solve problems for acceleration and velocity and they interpret graphs of velocity vs. time, acceleration vs. time...
Curated OER
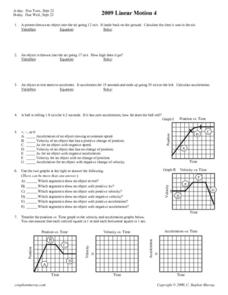
Linear Motion 4
In this linear motion worksheet, learners answer 12 questions including finding acceleration of moving objects, calculating distance objects travel and determining the time of travel. Students interpret graphs of position vs. time,...
Curated OER
Latent Heat of Fusion
Students conduct a series of investigation on latent heat of fusion. In this chemistry lesson, students explain how thermal storage systems work. They draw and interpret graphs.
Curated OER
Linear Motion 3
In this linear motion worksheet, students answer 11 questions including finding acceleration of moving objects, finding the distance objects travel and finding the time it takes objects to move a particular distance. Students interpret...
eGFI
Design a Green Rooftop Garden
Design and construct buildings with rooftop gardens. Junior engineers work in groups to build two buildings and then perform experiments to determine whether or not a garden affects the building's temperatures. They graph and interpret...
Curated OER
Show Me!
Students analyze and interpret graphs. In this graphing instructional activity, students view a video and construct their own graphs (line, circle, bar) from given sets of data.
Curated OER
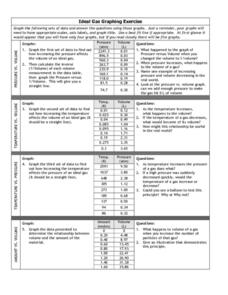
Graphing Exercise of Ideal Gas Data
For this graphing of Ideal Gas Data worksheet, students use the given data to draw 4 graphs of the given data. They are given the pressure and volume to draw and interpret the graphs.
Curated OER
Tides & Lunar Cycles
Students demonstrate how the moon affects the tides, a neap tide, and spring tides by using their bodies as models. After students observe the model they created, they draw and label the diagram on a provided worksheet. They then log...
Curated OER
Harmonic Motion
In this harmonic motion worksheet, students read about the difference between harmonic motion and linear motion. They are given the parts of harmonic motion, graphs of harmonic motion and equations to find the period and frequency of...
Curated OER
Linear Motion in Class Test Review
In this linear motion activity, learners answer 21 questions about acceleration, velocity, position and time. Students interpret graphs of position vs. time, velocity vs. time and acceleration vs. time. They calculate speed of objects,...
Curated OER
Plotting Data on a Graph
Students investigate graphing. In this graphing lesson, students survey the class and create graphs to reflect the data collected.


