Curated OER
Porosity and Permeability
Young scholars examine the concepts of porosity and permeability. They conduct experiments to determine the porosity and permeability of gravel, sand, and clay. After performing the experiments they collect and graph data, comparing...
Curated OER
Observing Osmosis in a Chicken Egg
Tenth graders develop a hypothesis and explain what they observed on an activity. In this investigative instructional activity students observe osmosis and report their data using a graph.
Curated OER
Evaluating Data
In this data activity, students learn how to organize the data collected during an experiment and practice finding patterns. Students graph a table of experimental data and complete 1 short answer question.
Curated OER
Chemical or Physical Change?
Eighth graders participate in several science activities to note chemical or physical changes after discussion. They understand that all matter has definite structure which determines physical and chemical properties.
Curated OER
HOW FAST DO SEDIMENT GRAINS OF DIFFERENT SIZES SETTLE?
Students conduct an experiment using sand, a jar, and a paper clip to analyze the effects of different kinds of sand vis a vis its sediment. They graph their findings and analyze for factors of size, shape, and density.
Curated OER
Art and Anatomy: The Vitruvian Teen
Students are introduced to the history of showing the human anatomy. In groups, they measure their height and arm spans to create a graph and determine if their measurements support Vitruvius' work. Individually, they make their own...
Curated OER
Linkages Between Surface Temperature And Tropospheric Ozone
Students collect and interpret data to make predictions about the levels of ozone in the atmosphere. Using the internet to collect data students use their collected data to create a line graph for analysis. Students make mathematical...
Curated OER
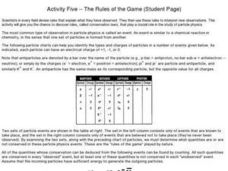
Particle Physics- Activity Five
In this particle physics worksheet, students use graphs and tables to predict the particles formed during a specific observation event. They complete 5 multi-part fill in the blank questions.
Curated OER
A Sweet Drink
Students investigate reaction rates. In this seventh or eighth grade mathematics lesson, students collect, record, and analyze data regarding how the temperature of water affects the dissolving time of a sugar cube. Studetns...
Virginia Department of Education
Hurricanes: An Environmental Concern
Hurricanes, typhoons, and tropical cyclones are the same type of storm, but their names change based on where they happen. Scholars use a computer simulation to learn about hurricanes. Then they hypothesize ideas to prevent hurricanes...
Curated OER
Using Current Data for Graphing Skills
Students graph demographic information. In this graphing lesson plan, students choose what type of graph to create and what information to display. Links to examples of graphs and statistical data are provided. The graphs are created on...
Alabama Learning Exchange
Explore the Transformations of Linear and Absolute Value Functions Using Graphing Utilities
Students explore the concept of transformations. For this transformation instructional activity, students use an applet that is an interactive absolute value graph applet. Students manipulate the applet to examine the change...
Curated OER
What Pie?
Students practice making and interpreting pie graphs so they are better able to decide if a pie chart is the appropriate form of display. Students examine included overheads of different pie charts, and directions on how to make pie...
Curated OER
Prediction
Students' recognize the various roles of predicting in science. Students' practice making and interpreting predictions; experimenting to test their hypotheses; and refine their predictions based on observation and experimentation....
Curated OER
Don't Let Parabolas Throw You
Students identify relation, function, patterns and range. For this algebra lesson, students factor and graph quadratic equations. They use transformation to move the parabola around and make predictions.
Curated OER
Thanksgiving Feast (Read the Charts)
Students practice reading charts about foods country of origin. They interpret information and answer questions related to charts. They discover how food production adds to the economy.
Curated OER
Find The Other Half
In this science worksheet, students interpret the graphs for the information that is related to measuring the different wavelengths for light or sound.
Curated OER
How Do Geology and Physical Stream-bed Characteristics Affect Water Quality?
Students examine geological bedrock in landscape regions and collect data. In this investigative lesson students retrieve data on the Internet then interpret, and graph it.
Curated OER
Hudson River Salt Front Activity
In this Hudson River worksheet, students read a passage about the Hudson and salinity, they complete graph interpretation and questions and activities.
Curated OER
Graph Both Crusts
Fourth graders calculate the angles and construct a pie graph of the percentages of the elements in the continental and oceanic crusts. Then they analyze the results. They can be assigned the task of researching the percentages.
Curated OER
Science: Hurricanes As Heat Engines
Learners conduct Internet research to track the path of Hurricane Rita. They record the sea surface temperature of the Gulf of Mexico during and after the hurricane and draw conclusions about how hurricanes extract heat energy from the...
Curated OER
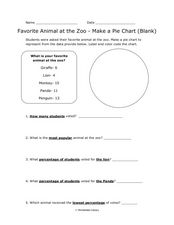
Pie Chart: Favorite Animal at the Zoo
In these three interpreting a pie chart and answering questions worksheets, students use the data provided to label and color code the blank and outlined pie charts, read and interpret a completed pie chart, and then answer questions...
Polar Trec
Who Will Melt First?
If the Greenland ice sheet melted, sea levels would rise by about 20 ft; if the Antarctic ice sheet melted, sea levels would rise by 200 ft. Scholars explore ice melting through the analysis of different ice samples, clean and dirty ice....
Teach Engineering
Air Pollution in the Pacific Northwest
Scholars investigate levels of nitrogen dioxide in the Pacific Northwest by examining the role of nitrogen in air pollution and how remote sensing can be used to measure nitrogen levels. An Excel spreadsheet calculates the difference...


