Alabama Learning Exchange
The State Capital of Stem and Leaf
Students explore the concept of stem and leaf plots. In this stem and leaf plots lesson, students plot the 50 US states' capitals on a stem and leaf plot according to the first letter of each state. Students compare...
Curated OER
Line of Best Fit
Learners explore the concept of linear regression. In this linear regression lesson, students do a Barbie bungee activity where they collect linear data. Learners plot their data using a scatter plot. Students determine a line of best...
Curated OER
Newton's Third Law and Aircraft Propulsion
Students research propulsion, graph data, and interpret the results.
Curated OER
Awesome Animals
Students collect data from classmates about their favorite animal. They use the ClarisWorks graphing program to enter data, graph results, and interpret data.
Curated OER
Lift/Velocity Relationship Problem Set
Students, after reading an explanation from a NASA Web-based textbook, demonstrate their ability to use, graph (using a graphing calculator), and interpret a text equation.
Curated OER
Mobile of Information
Pupils create a mobile of various geometric designs to be usend to display information from a variety of texts. They add graphics as well as graphs and charts, color, design and artwork to express the ideas learned through the different...
Curated OER
Lift Equation Problem Set
Learners, after reading an explanation from a NASA Web-based textbook, demonstrate an understanding of the text by using it, along with FoilSim, to complete an activity to graph and interpret the lift equation.
Curated OER
Measuring "pHacts" about Acid Rain
Sixth graders gather and graph information regarding the pH of rain. Working cooperatively with an internet partner, 6th graders gather and record information about the pH of the rain in their local area. They graph this information...
Curated OER
To Classify Beans And Peas
First graders record information on a bar graph and interpret the information given. They identify five different kinds of beans and three different kinds of peas. They work in groups of four and sort the beans by size or shape.
Curated OER
Home on the Biome
Fifth graders study six major biomes, graph temperature and rainfall, and present their findings to the class.
Curated OER
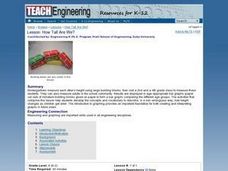
How Tall Are We?
Students in a Kindergarten class measure each other's height using large building blocks and then visit a 2nd and a 4th grade class to measure those students. They display the results in bar graphs, comparing the different age groups.
Curated OER
Water: On the Surface and in the Ground
Students explore the differences between surface water and ground water. They collect data using maps and graphs and investigate a Texas river basin and a nearby aquifer. They complete a written report including maps and data regarding...
Curated OER
Exploding Numbers
Students discuss how numbers increase when exponential growth is occurring. They view a video and compare exponential and linear growth with a graphing calculator.
Curated OER
One Square Foot
Students identify, describe, count, tally, and graph life found in one square foot of land.
Curated OER
Weather for Health
Ninth graders encounter various types of numerical information (represented in multiple ways), much of which is abstract and difficult to comprehend. In this activity, 9th graders will convert given information into bar graphs. In the...
Curated OER
Hibernating Hoopla
Students simulate hibernation with their stuffed animals. They predict the length of time of hibernation and type their math journal entries about sorting, graphing and draw pictures. They read bear hibernation stories.
Curated OER
Classification
Second graders sort insects into groups by determining similar characteristics. They role play as Entomologists to sort insects.
Curated OER
Math Lesson: How Many People Live There?
Students are able to calculate the population density of a country, and calculate the population density of large cities in that country. They are able to create an appropriate graph to represent their data for that country.
Curated OER
Keypals and You
Students collect and compare data received from keypals. They use electronic mail to exchange information with keypals and rrite a paper comparing similarities and differences between themselves and their keypals. In addition, use a...
Curated OER
Periodic Table
Learners relate to the idea of periodicity & give example of other periodic events and identify and use the periodic table as a useful resource. They also identify the relationship of elements to certain groups & periods &...
Curated OER
Circle the Earth - Explore Surface Types on a Journey around Earth
Students use CERES percent coverage surface data with a world map in locating landmasses and bodies of water at Earth's Equator.
Curated OER
On the Surface
Students draw and label the 15 major rivers in Texas. They then draw and label another map with the major lakes and reservioirs of Texas. Students use the maps and locate and label the location of the following major Texas cities:...
Curated OER
Scientific Inquiry: Periodic Motion
Young scholars construct their own pendulum. In this physics lesson, students design an experiment to find the factors affecting its period. They formulate a conclusion based on experimental data.
Curated OER
Class Final Report - Global Sun Temperature Project
Students reflect on the data they have analyzed during the Global Sun Temperature Project. They use the project website as a resource for their observations, draft a class report and post it on the Internet.


