Curated OER
Deer Tracks
Students use satellite images to track to movement patterns of deer and examine deer behavior. They write stories about a day in the life of a field scientist.
Curated OER
SC Populations Along Major Interstates
Students examine the population among the interstates in South Carolina. Using the internet, they identify the counties and roads and compare it with their own drawing.
Curated OER
Where's the Barbecue?
Students identify the major landforms, regions and rivers on a map of South Carolina. They compare the locations of the major Native American groups in the state as well. They chart where barbecue restaurants are located and write...
Curated OER
Civil War Letter Web
Students use the internet to gather information on a specific Civil War battle of interest to them. Using the information they gather, they organize it into a web to be used later when writing a letter. They use the web to write their...
Curated OER
Investigation of Timbre
Pupils design an experiment to analyze the timbre of different instruments. In this physics lesson, students analyze the missing quality in sound. They discuss their results in class.
Curated OER
Wing Area Effects Problem Set
Students read an explanation from a NASA Web-based textbook on lift and an explanation on the FoilSim software package given below. They use FoilSim to evaluate the relationship between wing area and lift.
Curated OER
Velocity Effects Problem Set
High schoolers, after reading an explanation on lift from a NASA Web-based textbook and an explanation on the FoilSim software package given below, use FoilSim to evaluate the relationship between velocity and lift.
Curated OER
The Four Seasons with "Charlotte's Web"
Students explore the characters and plot of the story, "Charlotte's Web" through the twenty-two lessons of this unit. Characters, facts, and details of the story are recalled and discussed and form the basis of several activities in this...
Curated OER
The Measurement of All Things: Atmospheric Detectives
Students identify the characteristics of aerosols. Using remote sensing, they participate in an experiment in which they determine how the sun's radiation and elements in the atmosphere interact with one another. They also research the...
Curated OER
Oregon City: A Convergence of Endings
Learners describe the activities that occurred in the Willamette Valley before the establishment of the Oregon Trail and agricultural settlement and explain the impact that American settlement had on the landscape and native groups who...
Curated OER
Instructional Software Resources for Grades K-3
Students become familiar with teh selection, evaluation, and use of instructional software for 4-8 classroom. They download software demos from the web and discuss critiquing software. Students browse software evaluations on web sites.
Curated OER
Lewis and Clark
Ninth graders study the plants and animals Lewis and Clark discovered on their expedition. There is a plant illustrator, a plant recorder, an animal illustrator, and an animal recorder. They research the plants and animals and the ...
Curated OER
Numerical Determination of Drag Coefficients
Learners create a video of an object falling with a drag. In this physics instructional activity, students calculate drag coefficient using data from Logger Pro. They calculate velocity and acceleration of the object.
Science Buddies
Science Buddies: Interpreting Area Data From Maps vs. Graphs
Graphical methods of data presentation are a key feature of scientific communication. This project asks the question, "What's the best way to compare the land area of states: a map or a bar graph?" You'll be measuring performance on two...
The Wonder of Science
The Wonder of Science: 5 Ess2 2: Water Availability and Distribution
With these lessons, student can provide evidence to how water is distributed around Earth by interpreting graphs of the amounts and percentages of water in various reservoirs. On this site find work samples, phenomena, assessment...
Vision Learning
Visionlearning: Data: Using Graphs and Visual Data in Science
An explanation of how data can be turned into visual forms which can help people comprehend information easier than observing numbers.
US Geological Survey
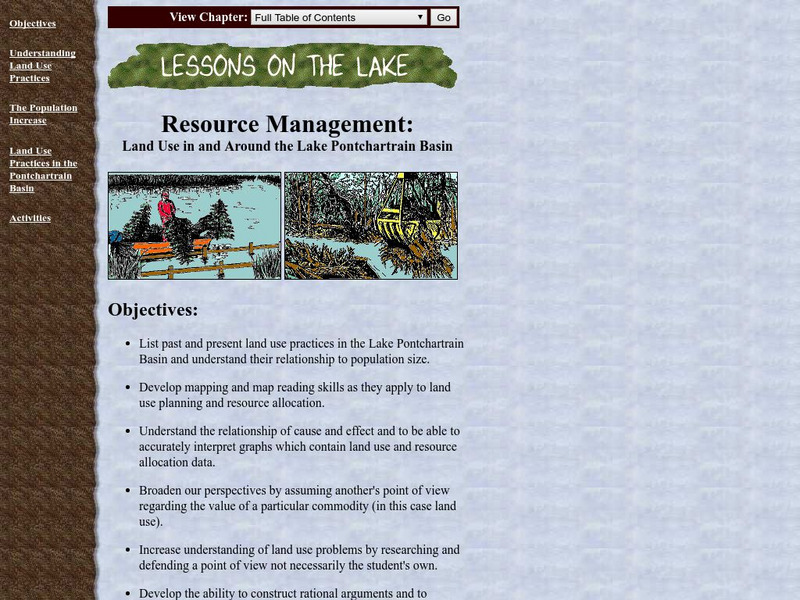
Lake Pontchartrain Basin Foundation: Resource Management
A variety of activities to show students how population size relates to how land is used in the Lake Pontchartrain Basin. Activities provide opportunities for students to interpret graphs, read maps, research problems, defend a side, and...
NASA
Nasa: Why Is Carbon Important?
Students explore the relationship between atmospheric carbon dioxide concentrations and temperature, and how these relate to climate change. Graph and map data are used as evidence to support the scientific claims they develop through...
Missouri State University
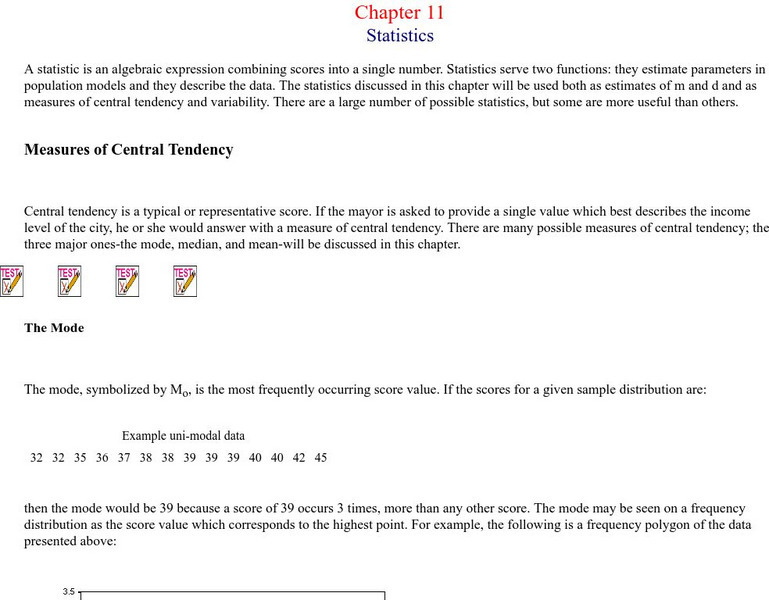
Missouri State University: Introductory Statistics: Statistics
This is an excellent resource on what the science of statistics involves. There are all kinds of definitions, examples, graphs, and charts to learn from. The topics covered include: mode, mean, median, skewed distributions and measures...

