Hi, what do you want to do?
CK-12 Foundation
Ck 12: Statistics: Interpretation of Circle Graphs Grades 6 7
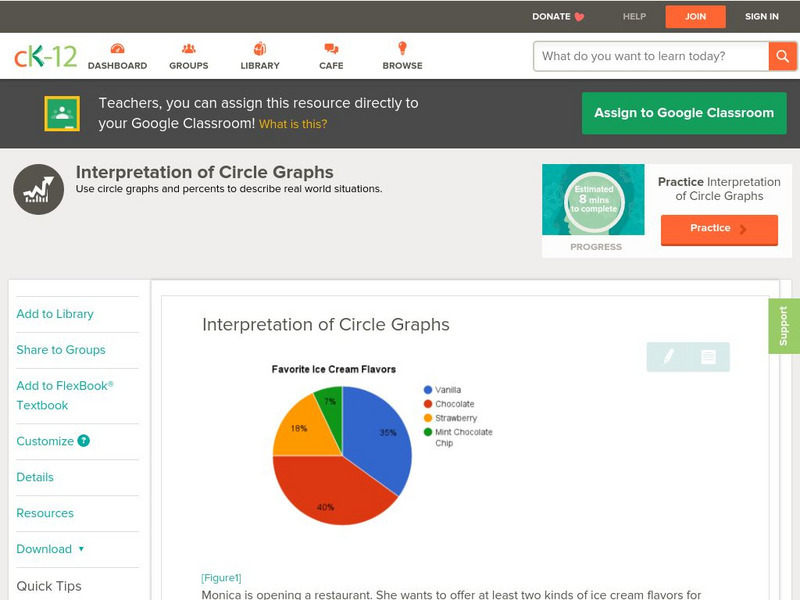
[Free Registration/Login may be required to access all resource tools.] Read and interpret circle graphs.
CK-12 Foundation
Ck 12: Statistics: Interpretation of Circle Graphs Grade 7
[Free Registration/Login may be required to access all resource tools.] Interpret circle graphs by using given data.
Government of Alberta
Learn Alberta: Math Interactives: Exploring Data Display and Graphs
This multimedia Learn Alberta math resource focuses on graphing data. In the video portion, learners will see how math is involved in the display of merchandise in stores. The accompanying interactive component provides an exploration...
E-learning for Kids
E Learning for Kids: Math: Movie Theater: Circle Graphs
On this interactive website, students practice interpreting information in circle graphs.
CK-12 Foundation
Ck 12: Statistics: Pie Charts Grade 6
[Free Registration/Login may be required to access all resource tools.] Interpret circle graphs and make predictions based on the displayed data.
Government of Alberta
Learn Alberta: Math Interactives: Exploring Election Data
Using actual Alberta provincial election results, students have the opportunity to interpret election data using a variety of graph types. Pictographs, line graphs, bar graphs, circle graphs, and data tables are covered in this...
Texas Education Agency
Texas Gateway: Analyze Graphical Sources: Practice 2 (English I Reading)
You will look at each of these types of graphs: bar graph, line graph, pie charts, as you work your way through the lesson.
Oswego City School District
Regents Exam Prep Center: Practice With Organizing and Interpreting Data
Several problems are presented to test your skills in creating and interpreting frequency tables, pie charts, box-and-whisker and stem-and-leaf plots.
E-learning for Kids
E Learning for Kids: Math: Treasure Island: Interpreting Data
Students will play interactive games to interpret information from different types of graphs.


