Curated OER
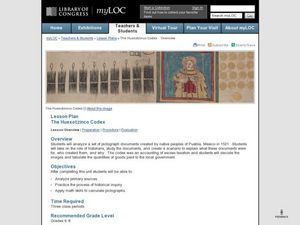
Lesson PlanThe Huexotzinco Codex
Students examine primary sources that include pictographs from Puebla, Mexico. For this Huexotzinco Codex lesson, students perform historical analysis as they investigate the codex as they make inferences and draw conclusions about taxes...
Curated OER
History in Pictures
Sixth graders interpret diary entries, letters and read maps to better understand portions of history. They create an oral presentation demonstrating understanding of how cultural characteristics have been communicated through art,...
Curated OER
Graphs Galore
Fourth graders conduct surveys to collect data. They analyze and interpret the data, then determine which type of graph is appropriate for the data. Students use the data to make predictions, discover patterns and draw conclusions...
Curated OER
Data Collection and Presentation
Students concentrate on discrete quantiative data. They are shown that the vertical line diagram as a more appropriate way to present discrete quantiative data then bar charts. Students work as a group to help with the interpretation...
Curated OER
Candy Land Math
Students order numbers and sets of objects from 0 through 10 and organize and interpret information collected from the immediate environment. They read and interpret graphs usin real objects and the computer. Finally, students sort a...
Curated OER
Graph It
First graders collect classroom data (such as mode of transportation used to get to school) and prepare a pictograph to interpret the information.
Curated OER
Farm Census
Students disuss the work of a farmer. They recognize and name farm animals to represent the information in a pictogram.
Curated OER
What's Your Favorite Stuffed Animal?
Second graders gather information in a survey and interpret the results using a tally chart, a table, and a bar graph. They' present their results of the during the final group discussion. The subject of the survey is favorite stuffed...
Curated OER
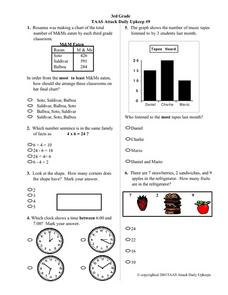
3rd Grade TAAS Attack Daily Upkeep #9
In this math literacy worksheet, 4th graders practice interpreting the pictographs in order to assemble the information to find the solutions to the 13 problems.
Curated OER
Many Ways to Represent Our Data
Demonstrate several ways to represent data with your class. They will use surveys to gather data and display the data using tally charts and graphs. Then answer questions according to the data.
Curated OER
Measuring Volume/Capacity Using the Metric System
There is more than one way to measure an amount, as learners discover by applying multiple measurement tools in these activities. Centimeter cubes, cylinders, beakers, and measuring cups are used to find the volume of regular and...
Curated OER
Build a Bar Graph
Learners discover how to use bar graphs. They will gather and organize specific data in order to put it into a bar graph. Then they will answer several questions based on the information they have graphed.
Curated OER
Using Charts and Graphs to Study East Asia's Modern Economy
Students examine East Asia's modern economy. In groups, classmates use the internet to compare the resources, products, and economy of specified countries. After collecting the data, pupils create charts, tables and graphs. They...
Curated OER
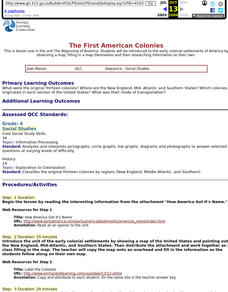
The First American Colonies
Fourth graders are introduced to the early colonial settlements of America by observing a map, filling in a map themselves and then researching information on their own.
Curated OER
Jelly Belly: What a Wonderful "Bean"!
Students explore how jelly beans are produced. They discuss the origins of the jelly bean and view a video about how jelly beans are prepared, tested, shaped, finished, and shipped and estimate the amount of jelly beans in a jar and sort...
Curated OER
Statistics of Mars
Students explore the concept of central tendencies. In this central tendencies lesson, students sort M&M's or Skittles based on color. Students graph their results. Students find the mean, median, and mode of their data.
Curated OER
What's Data?
Learners get the opportunity to investigate the concept of data collecting. They explore how to tally and read a bar graph. Vocabulary about data is also be included. At the end of the lesson, individual students collect data independently.
Curated OER
All in the Family
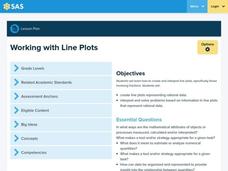
Students use data to make a tally chart and a line plot. They find the maximum, minimum, range, median, and mode of the data. Following the video portion of the activity, students will visit a Web site to test their data collection...
Curated OER
WHAT IS THE POPULAR COLOR?
Fourth graders graph cars according to their colors. They complete the graph including a title, scale, x-axis, and y-axis. Students collect the data and choose the type of graph to be made.
Curated OER
Curious Clouds
Second graders explore clouds. They read The Cloud Book by Tomie dePola. Students sort the cloud pictures into three categories. Students create a graph using the cloud pictures. They use Excel to create a bar graph.
Alabama Learning Exchange
How Clouds Form
Young scholars analyze how clouds form. In this cloud formation lesson, students brainstorm types of clouds and what they think they're made of. Young scholars conduct an experiment to see how clouds form and discuss their observations....
Curated OER
FLIGHT FAIR
Students conduct their personal investigations into paper airplane flight. Cooperative teams are formed, with students choosing the paper airplane design that they are most interested in building.
Curated OER
Cars on the Curve
Second graders, using two dice, participate in a car race game called Cars on the Curve. They predict which car wins the game and records it in their Data Diary.
Curated OER
Jack and the Beanstalk Math
Students listen to Jack and the Beanstalk and determine what they think are the most common words. In this Jack and the Beanstalk lesson, students reread the story, count the words they chosen and graph those words. Students graph the...


