Curated OER
Worksheet 12
In this math instructional activity, students explain the vector parametric equation for a line, scalar parametric equations, symmetric equations, and the implicit equation for a line.
Curated OER
Stravinsky and the Rite of Spring
In this Stravinsky worksheet, students answer the 20 short answer questions and write 1 essay in relation to the extract, "The Rite of Spring".
Curated OER
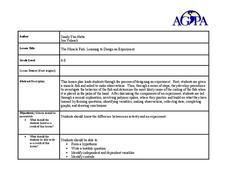
The Miracle Fish: Learning to Design an Experiment
Students develop procedures to explore the behavior of fish. In this scientific experiment lesson students from a hypothesis, write a question, identify different variables and controls in their experiment.
Curated OER
Measuring & Graphing Motion
Fifth graders study how to measure distance. In this graphing motion lesson students complete a lab activity that shows them on the computer how to make graphs.
Curated OER
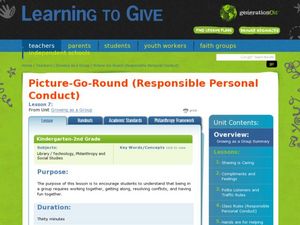
Picture-Go-Round
Students demonstrate how to participate in a cooperative group. In this philanthropy lesson, students create drawings by working together as a group and contributing their thoughts and feelings.
Curated OER
My Test Book: Least Common Multiples
In this math skills worksheet, students solve 10 multiple choice math problems regarding least common multiples. Students may view the correct answers.
Curated OER
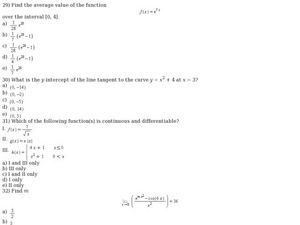
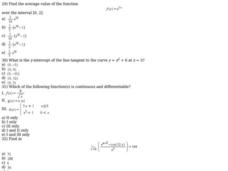
Find the Average Value of a Function
In this calculus worksheet, 11th graders calculate the average value of a function. They find the line tangent to a curve and graph the equation. There are 15 questions.
Curated OER
Sixteen Multiple Choice AP Calculus BC Exam Preparation Questions
In this review for Calculus BC exam worksheet, students solve sixteen various multiple choice problems. These problems are designed as review and preparation for the AP Calculus Exam.
Curated OER
Converging Series
In this functions worksheet, students calculate the average value, continuity, and the radius of convergence. There are 17 multiple choice questions.
Curated OER
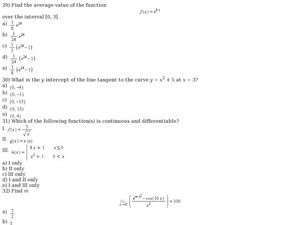
Average Value of a Function
In this calculus learning exercise, 12th graders calculate the line tangent to a curve and find the average value of a function. There are 12 questions.
Curated OER
Relating Graphs to Events
In this algebra worksheet, students identify the graph that goes with-the equation. They solve word problems using graphs. There are 4 problems with an answer key.
Curated OER
Linear Functions
Students solve and graph linear equations. In this algebra lesson, students collect data and plot it to create a linear function. They identify the domain and range of each line.
Curated OER
The Little Ice Age - Understanding Climate and Climate Change
Fourth graders receive data about tree ring records, solar activity, and volcanic eruptions during the Little Ice Age (1350-1850). From this data, they draw conclusions about possible natural causes of climate change
Curated OER
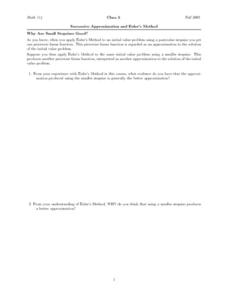
Successive Approximation and Euler's Method
In this approximation activity, students use the Euler's method to interpret a piecewise linear function. They explore why the approximation produced using a smaller stepsize is a better approximation. This four-page activity contains...
Curated OER
Speed of a Forest Stream
Students study stream speed. In this stream speed lesson students complete an activity and formulate an opinion and study its effects.
Curated OER
During and For Exercise
In this grammar skills worksheet, students respond to 15 fill in the blank and short answer questions regarding the use of the prepositions "for" and "during."
Curated OER
Physical Education - Gallop
Students practice galloping. For this gross motor skills lesson, students review how to jump and hop using a jump-rope and hopscotch. The teacher shows the steps to gallop and they hold a noodle and pretend as if they are riding a...
Curated OER
Creating Line Graphs
Pupils draw line graphs. In this math lesson, students interpret minimum wage data and graph the data in a line graph. Pupils predict the next minimum wage and figure the earnings for a 40 hour work week for someone earning the minimum...
Curated OER
How Much Will I Spend On Gas?
Students construct a linear graph. In this graphing lesson, students determine a monthly budget for gasoline. Students construct a t-chart and coordinate graph to display data. Resources are provided.
Curated OER
Pulley Power
Third graders engage in a manipulative experiment in the mechanical advantage of simple machines. It graphically demonstrates the change in magnitude of applied force when using simple machines. Great for ESL to discover the ratio...
Curated OER
Graphing Valentine Candies
Fifth graders organize and display information in bar graph form using appropriate labels. Each student receives a box of Valentine heart candies, a worksheet of the tally chart and a worksheet of the bar graph.
Curated OER
Simple Bar Graphs Using Excel
Young scholars create original survey questions, and develop a bar graph of the data on paper. They input the survey data using two variables onto an Excel bar graph spreadsheet.
Curated OER
Risky Business
High schoolers view a video on AIDS, HIV and the ways in which HIV is spread. They discuss ways to avoid contracting HIV and participate in a simulation that shows the growth of a communicable disease.
Curated OER
Behind the Movie Chicago
Students explore the genre of the musical film and its history. They draw conclusions on relationships between a stage musical and a musical film. They share the results of their research as a class.
Other popular searches
- Time Intervals
- Time 5 Minute Intervals
- Tell Time 1 Hour Intervals
- Time Intervals in Math
- Math Time Intervals
- Telling Time Intervals
- Time in 5 Minute Intervals
- One Minute Interval
- Time Intervals Lesson Plans


