PBS
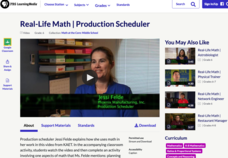
Real-Life Math — Production Scheduler
Use unit rates to find the number of parts needed to produce a given number of units. A production scheduler shares the different ways schedulers use math to ensure the required amount of parts are available to manufacture air...
Bowland
Fashionista
So trendy! Show your class how to identify trends in sales patterns using mathematics. Scholars use a software simulation to collect data on age groups, price, and sales at a fashion store. This data allows individuals to determine the...
Achieve
Ground Beef
Ever wonder how a butcher creates the different types of ground beef? Young mathematicians explore the methods butchers use to create their desired ground beef quality. Given a combination of two types of meat with varying...
Curated OER
An Archaeological Adventure in Athens
Students review map skills and practice finding locations on a map. In groups, they create maps with mystery locations identified by hidden stick-on magnets. Other groups attempt to find the mystery locations and then check their work...
Curated OER
The Study of Urban and Suburban Environments within the Mystic River Watershed
High school learners examine their own water-based environments, within the Mystic Watershed. As the learners engage in inquiry-based, hands-on projects, critical thinking skills and problem-solving, the project will lead them to cross...
Curated OER
Getting Into Shapes: Identifying and Describing Two-Dimensional Shapes
Young scholars examine their classroom to find examples of various types of shapes. After identifying and describing the various shapes, they draw as many as they can on a piece of paper. They organize them into an image based on their...
SMART Project
Shop with Us at Whelan School
Third graders use their math and research skills to create and manage a classroom/school store. They use a computer to manage, organize and access information. They practice pricing products, computing sales, counting money and...
Curated OER
Using Part To Whole
Learners engage in a math activity that is concerned with developing problem solving skills. They emphasize the cognitive reasoning of seeing parts as pieces to a whole. Writing is integrated into a cross-curricular study of math.
Curated OER
A Sweet Story: Estimation
In this estimation story problem worksheet, students read a rhyme about Pop's candy store inventory and solve and explain word problems answers. Students solve five problems.
Curated OER
Organizing Data Using Tables and Graphs
Students create graphs and tables, as well as interpret and make inferences from the data shown to determine when and where graphs and tables are most useful.
Curated OER
"Comprehension of Word Problems" Using a Table
Sixth graders practice solving math problems by utilizing a data table. In this number sense activity, 6th graders create a table using the numerical information about a fictitious farm's inventory. Students complete the empty segments...
Curated OER
Percentage War
Fifth graders explore fractions by participating in a card activity in class. In this percentages lesson, 5th graders inventory the amount of different cards in a deck in order to determine the percentages of getting a certain card....
Curated OER
Hot Dog Stand: The Works
Students strengthen skills in mathematics, problem solving, and communication skills by working together in groups using "Hot Dog Stand: The Works" educational software.
Teach Engineering
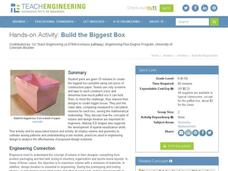
Build the Biggest Box
Boxing takes on a whole new meaning! The second installment of the three-part series has groups create lidless boxes from construction paper that can hold the most rice. After testing out their constructions, they build a new box....
Curated OER
Budgeting for the Future
Eighth graders determine the net amount of an income for a fictional job. They must determine their net worth minus standard deductions. Students must then determine their monthly budget including, groceries, credit, and rent.
Curated OER
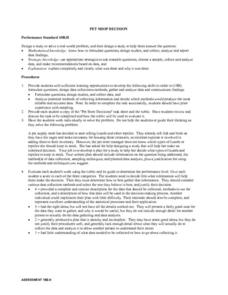
Pet Shop Decision
Students are given the "Pet Store Decisions" task sheet and a rubric that goes with it. Students discuss the task and make a plan for using the rubric sheet to complete the task. Students formulate questions, studies and data collection...
Curated OER
Developing Environmental Awareness Through Problem Solving
Students examine the relationships among living and non-living parts of the environment. Using their senses, they identify the objects in their classroom. In groups, they participate in experiments to discover where electricity comes...
Curated OER
Mean, Median, Mode and Range
Fourth graders investigate when to find the mean, median, mode and range. In this statistical concepts lesson, 4th graders collect data, make observations and graph the data. Students verify their work on the computer.
Curated OER
Introduction to Measuring the Forest
Students investigate how much wood is in a forest. In this forestry lesson, students calculate how much usable wood comes from the forest. They will read, Sizing Things Up from Trees + Me = Forestry, measure firewood piles, and create a...
Curated OER
The Best Vacation Ever
Learners research various vacation destinations and the costs of travel. In this vacation planning lesson, students obtain information for various purposes, research sites, document their findings, learn about geographical regions, and...
Curated OER
Statistical Analysis
In this statistics worksheet, students analyze the data provided in order to determine the null hypothesis, an alternate hypothesis, and the significant difference between the groups. The one page worksheet contains three scenarios...
Curated OER
At Home on the French Frontier: 1700-1800
Students role play bartering for goods and services as the French settlers did in colonial Illinois. They start with eight household items to acquire through bartering. They have to calculate values for each object and determine the...
Curated OER
Dressing in Early American Times
Fifth graders, by doing research and seeing actual and simulated artifacts, gain knowledge of and make comparisons about clothing in the Colonial and early Republican eras with attire of present time.
Curated OER
And Around We Go!
Sixth graders conduct a survey and collect data to construct a bar graph that will then be changed into a circle graph. With the bar graph, 6th graders compare estimated fractions and percentages and estimate percentages. With the circle...
