Curated OER
Perplexing Puzzles
Elementary and middle schoolers explore scatter plots. In this graphing lesson, pupils work in small groups and use jigsaw puzzles to develop a scatter plot. Younger learners may develop a bar graph.
Curated OER
Problem Solving Decisions: Choose a Method
Walk your scholars through the process of finding percentages using this problem-solving instructional activity! A word problem asks students to figure out how many pieces of a puzzle are left, if the completed 750 pieces make up 60% of...
Mathed Up!
Cumulative Frequency and Box Plots
Learn how to display data. Young data analysts watch a video to review how to create cumulative frequency histograms and box plots. They work on a set of questions to practice producing these data displays.
Curated OER
Percent Word Problems
In this online worksheet, students will solve 10 problems involving percents. Answers can be accessed by clicking hint or check.
Curated OER
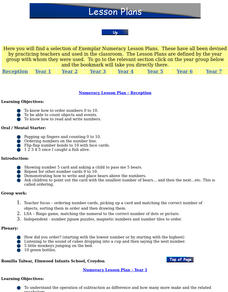
Numeracy Lesson Plan: Reception
Students examine number sense by participating in identification activities. For this number value lesson, students practice counting from 1-10, identifying number flash cards, reading clocks and multiplying basic numbers. Students...
Other popular searches
- Tectonics Jigsaw Puzzle
- Continental Jigsaw Puzzle
- Word Jigsaw Puzzle
- Jigsaw Puzzle Strategy
- Jigsaw Puzzle Community
- The Jigsaw Puzzle
- Jigsaw Puzzle for Algebra
- Jigsaw Puzzle States
- Snowman Jigsaw Puzzle
- Jigsaw Puzzle Autobiography
- Blank Jigsaw Puzzle Pieces
- Jigsaw Puzzle Activity


