Curated OER
Jumping to Conclusions
Students decide as a class what their data is going to be to graph. In this math activity, students organize data so that it will be easier to display in a graph. Students are guided through the process by their teachers, and helped with...
Curated OER
Plastic Packaging
Young scholars collect data. In this math lesson, students collect data about recyclable materials. Young scholars develop a plan that will help the environment. Recycling plastic containers is discussed.
Noyce Foundation
Through the Grapevine
Teach statistics by analyzing raisins. A thorough activity provides lesson resources for five levels to include all grades. Younger pupils work on counting and estimation, mid-level learners build on their understanding of the measures...
Curated OER
Measure Up!
Discover ways to measure items without standard tools. In this measurements instructional activity, learners estimate how long certain objects are by measuring with a non-standard measuring tool. Students check their estimates with a...
Curated OER
A Frog's Life Story
Students investigate the lives of frogs by completing several worksheets. In this biology lesson, students discover the life cycle of a frog from tadpole to death. Students complete frog life cycle puzzle as well as create a life cycle...
Curated OER
Making Graphs
Students explore statistics by conducting class demographic surveys. In this graph making lesson, students identify the family members of each classmate, pets they own, and favorite activities. Students organize their statistics and...
Curated OER
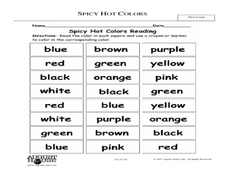
Spicy, Hot Colors
Students demonstrate an understanding of colors. In this visual arts activity, students read the text Hot, Spicy Colors and name their favorite colors. Students complete a bar graph to show the data. Students discuss how each color can...
Other popular searches
- Everyday Math
- Elementary Math
- Esl Lessons Math
- Estimation Math
- Elementary Math Lessons
- Math in Everyday Life
- Math Expressions
- Elementary Math Patterns
- Math Enrichment
- Easter Math
- Esl Math Vocabulary
- Basic Math Equations


