Curated OER
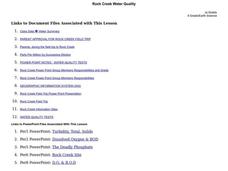
Rock Creek Water Quality
Ninth graders test water in a local creek using chemical kits and probes. They take GPS readings and digital photos. They calculate the Water Quality Index and create a spreadsheet of the test data.
Curated OER
Rock Creek Water Quality
Ninth graders test water in a local creek using chemical kits and probes. They take GPS readings and digital photographs. They calculate the Water Quality Index and create a spreadsheet.
Curated OER
Seasonal Cloud Cover Variations
Students, in groups, access data from the NASA website Live Access Server regarding seasonal cloud coverage and the type of clouds that make up the coverage. They graph the data and make correlations between types, seasons and percentages.
Alabama Learning Exchange
The Sun and the Earth
Third graders study and diagram the positions of the Earth and sun during the four seasons. They predict weather for cities in the northern and southern hemispheres.
Curated OER
Compass Building Instructions
Learners build their own compass following a given procedure. In this technology lesson, students explain how a compass is used in navigation. They trace the history of its development.
Curated OER
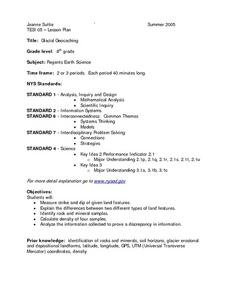
Glacial Geocaching
Eighth graders measure strike and dip of given land features and explain the difference between them. They also look at rock and mineral samples for indentification, along with calculating the density. Finally, information is analyzed...
Curated OER
Mapping a Refuge
Students record observations gathered while at a national wildlife refuge. For this lesson on wildlife refuges, students choose an observation spot and record seasonal changes throughout the year.
Curated OER
Seasonal Cloud Cover Variations
Students recognize different cloud types. They determine the seaonality of various types of clouds. They graph the data and determine if a correlation exists between season, cloud cover and type of clouds most prevalent during each season.
Curated OER
Creating and Analyzing Graphs of Tropospheric Ozone
Students create and analyze graphs using archived atmospheric data to compare the ozone levels of selected regions around the world.


