CK-12 Foundation
Ck 12: Statistics: Stem and Leaf Plots Grade 8
[Free Registration/Login may be required to access all resource tools.] Create and interpret data through stem-and-leaf plots.
Better Lesson
Better Lesson: Places Everyone. Analyzing and Creating Stem and Leaf Plots
The students will be using discovery techniques to learn about stem and leaf plots.
CK-12 Foundation
Ck 12: Statistics: Stem and Leaf Plots, Range of a Data Set
[Free Registration/Login may be required to access all resource tools.] Find the range of a set of data displayed in a stem-and-leaf plot.
Varsity Tutors
Varsity Tutors: Hotmath: Algebra Review: Stem and Leaf Plots
Find a quick, concise explanation of stem-and-leaf plots. an example is given and clearly explained.
Houghton Mifflin Harcourt
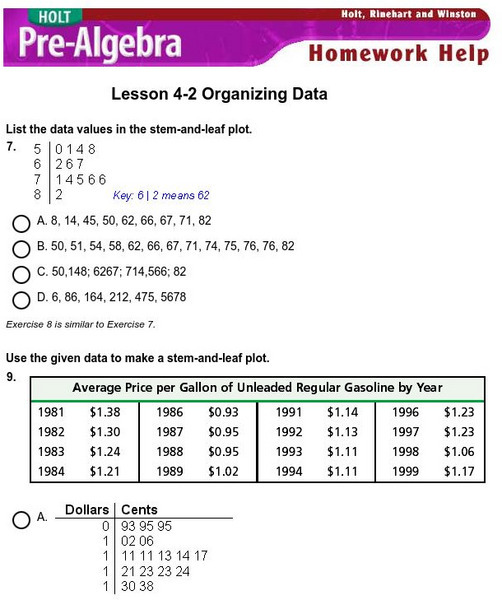
Holt, Rinehart and Winston: Homework Help Independent Practice: Stem and Leaf Plot
Get independent practice organizing data and using stem-and-leaf plots. Each incorrect response gets a text box explanation and another try. Correct responses are confirmed.
Rice University
Hyper Stat Online Statistics Textbook: Stem and Leaf Plots Defined
A nice site for a defintion and example of finding a stem and leaf plot in statistics.
National Council of Teachers of Mathematics
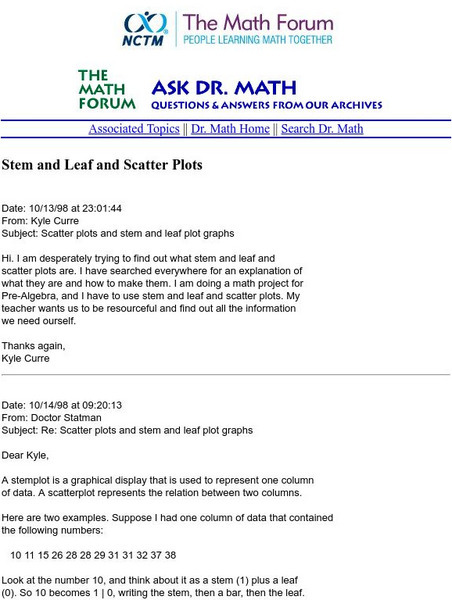
The Math Forum: Nctm: Ask Dr. Math: Stem and Leaf and Scatter Plots
This site is a question/response page which focuses on stem-and-leaf representation and how to construct scatter plots. Dr. Math works through an example and gives commentary notes. Site also contains links for more help.
Varsity Tutors
Varsity Tutors: Hotmath: Practice Problems: Stem and Leaf Plots
Eight problems present various aspects of using stem-and-leaf plots. They are given with each step to the solution cleverly revealed one at a time. You can work each step of the problem then click the "View Solution" button to check each...
Shodor Education Foundation
Shodor Interactivate: Lesson: Stem and Leaf Plots
Lesson plan introduces students to stem-and-leaf plots. Many resources are available for student and teachers here.
ClassFlow
Class Flow: Stem and Leaf Diagrams
[Free Registration/Login Required] In this flipchart, students develop an understanding of algebraic sense by recognizing sequences between sets of numbers and linear patterns. Students apply their understanding to recognize the formulas...
Scholastic
Scholastic: Cultivating Data
Students will understand key concepts of data analysis and their graphic representations. Students will construct and interpret data tables, line plots, box-and-whisker plots and stem-and-leaf plots, scatterplots with line of best fit,...
Other
Stem and Leaf Plotting
A nice explanation of a stem and leaf plot, accompanied by many helpful examples.
Sophia Learning
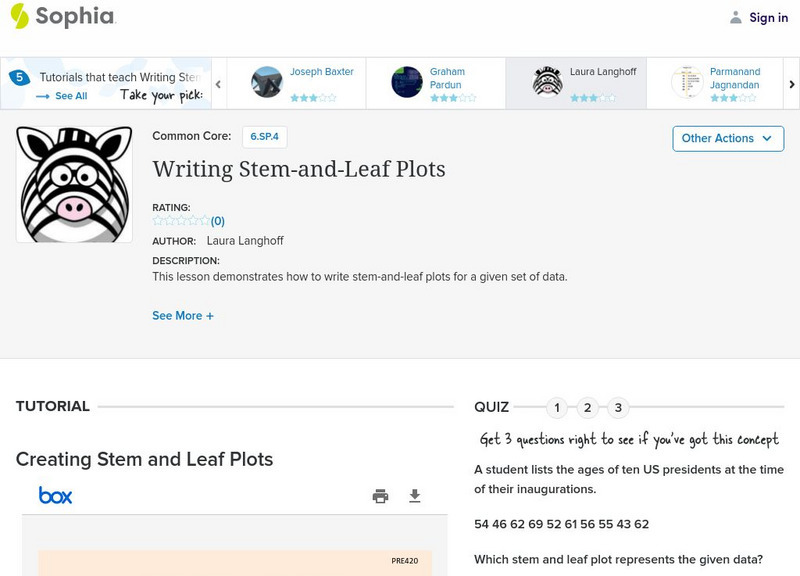
Sophia: Writing Stem and Leaf Plots: Lesson 3
This lesson demonstrates how to write stem-and-leaf plots for a given set of data. It is 3 of 5 in the series titled "Writing Stem-and-Leaf Plots."
Sophia Learning
Sophia: Writing Stem and Leaf Plots: Lesson 4
This lesson demonstrates how to write stem-and-leaf plots for a given set of data. It is 4 of 5 in the series titled "Writing Stem-and-Leaf Plots."
Sophia Learning
Sophia: Writing Stem and Leaf Plots #3
This lesson demonstrates how to write stem-and-leaf plots for a given set of data.
Sophia Learning
Sophia: Writing Stem and Leaf Plots #4
This lesson demonstrates how to write stem-and-leaf plots for a given set of data.
Shmoop University
Shmoop: Basic Statistics & Probability: Stem & Leaf Plots
Students learn about stem and leaf plots. Notes, examples, and practice exercises are included in the statistics resource.
CK-12 Foundation
Ck 12: Statistics: Displaying Univariate Data
[Free Registration/Login may be required to access all resource tools.] This Concept shows student how to make stem-and-leaf plots as well as dot plots in order to display data with one variable.
Other
Northern Michigan University: Stem and Leaf Plot
Site discusses how to use stem-and-leaf plots with an example and the steps listed for easy reading.
Calculator Soup
Calculator Soup: Stem and Leaf Plot Generator
Generate an online stem and leaf plot, or stemplot, and calculate basic descriptive statistics for a sample data set with 4 or more values and up to 1000 values, all non-negative.
University of South Florida
Fcat: Drops on a Penny: Teacher Notes
Students learn how to create stem-and-leaf diagrams and boxplots by collecting data on the surface tension of water molecules. This hands-on activity using pennies is a great way to learn how to organize data.
PBS
Pbs Mathline: Wet Heads Lesson Plan [Pdf]
Students will record the number of drops of water in a stem-and-leaf plot that will fit on top of a penny. Printable lesson plan.
University of Illinois
University of Illinois: Statistics a La Mode
Site from the University of Illinois gives examples using stem and leaf plots to find the mode. It also provides practice examples for students to try. It gives the correct answers and provides a definition of the word mode and where it...
Other
Online Statistics Education: Graphing Distributions [Pdf]
This is the second chapter of a statistics e-text developed collaboratively by Rice University, University of Houston Clear Lake, and Tufts University. It looks at many different types of data displays and the advantages and...


