Curated OER
Math and Numbers - Addition Table Exercise
In this addition worksheet, students fill in the blanks in the table with the correct sum. There are 121 blanks to fill in on this worksheet.
Education Development Center
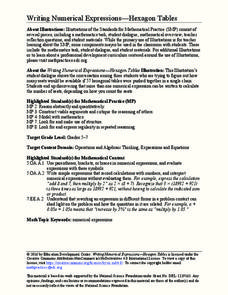
Writing Numerical Expressions—Hexagon Tables
Explore a basic pattern to practice writing expressions. In collaborative groups, learners examine a contextual pattern and write an expression to model it. The task encourages groups to describe the pattern in multiple ways.
Stats Monkey
Everything I Ever Needed to Learn about AP Statistics I Learned from a Bag of M and M's®
Candy is always a good motivator! Use this collection of M&M's® experiments to introduce statistics topics, including mean, standard deviation, nonlinear transformation, and many more. The use of a hands-on model with...
EngageNY
Conducting a Simulation to Estimate the Probability of an Event II
Add some randomization into simulations. The 11th installment in a series of 25 presents two new methods to use in simulations--colored disks, and random numbers. Pupils use random numbers to run simulations where the probabilities make...
Curated OER
Practice: Word Problems
Congratulations, you've just hit the word problem jackpot! Covering an incredible range of topics from integers and fractions, to percents, geometry, and much more, this collection of worksheets will keep young mathematicians...
EngageNY
Summarizing a Data Distribution by Describing Center, Variability, and Shape
Put those numbers to work by completing a statistical study! Pupils finish the last two steps in a statistical study by summarizing data with displays and numerical summaries. Individuals use the summaries to answer the statistical...
Noyce Foundation
Granny’s Balloon Trip
Take flight with a fun activity focused on graphing data on a coordinate plane. As learners study the data for Granny's hot-air balloon trip, including the time of day and the distance of the balloon from the ground, they practice...
Digging Into Math
Classifying Triangles
Young mathematicians explore the world of three-sided shapes in this instructional activity on the different types of triangles. Starting with a general introduction to classification using Venn diagrams, children learn how to...
Utah Education Network (UEN)
Analyze Proportional Relationships and Use Them to Solve Real-World Problems
What proportion of learners will benefit from the lessons on proportional reasoning? Class members learn about proportional relationships, from unit rates to writing equations for proportional relationships. Then, they learn to use...
Mathed Up!
Negative Numbers
Individuals read tables with temperatures and times in order to distinguish the town with the lowest temperature or most extreme temperature difference. Each of the eight questions has three sub-questions that use the same charts.
Curated OER
Math Vocabulary
In this math vocabulary worksheet, students are exposed to math words that they should learn in school during year 1. There are 19 flashcards in this packet that can be used to assist students in learning these vocabulary words.
Curated OER
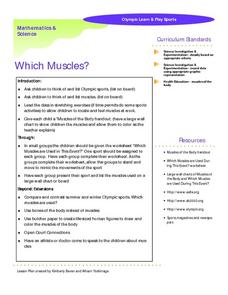
Which Muscles?- Olympic Learn and Play Sports
In this math, science, and physical education worksheet, learners brainstorm and study about the muscles that are used while participating in different Olympic sports. They color the muscle groups of the body by follow the directions...
Mathed Up!
Cumulative Frequency and Box Plots
Learn how to display data. Young data analysts watch a video to review how to create cumulative frequency histograms and box plots. They work on a set of questions to practice producing these data displays.
Curated OER
Bungee M&M's
Science is exciting - and delicious! Pairs of learners set up a bungee cord type of experiment. They use buckets filled with M & M's, a meter stick, and a Slinky spring (as the bungee) to conduct their experiment. A good activity...
Curated OER
Dance Challenge: Calculate and Compare Speed by Measuring a Series of Dance Movements
Really neat! Kids choreograph a dance phrase and then measure the distance and speed of the phrase using a timer and a meter stick. They collect the data on a table which they use to determine an average. A series of observation and...
Curated OER
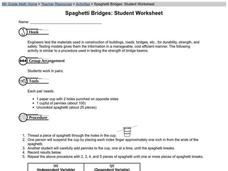
Spaghetti Bridges: Student Worksheet
Pairs of learners work together in order to simulate how engineers test materials for strength and safety in the real world. They use paper cups and pieces of spaghetti to run strength tests. This excellent instructional activity should...
EngageNY
Modeling from a Sequence
Building upon previous knowledge of sequences, collaborative pairs analyze sequences to determine the type and to make predictions of future terms. The exercises build through arithmetic and geometric sequences before introducing...
Virginia Department of Education
Graphing Linear Equations
Combine linear equations and a little creativity to produce a work of art. Math scholars create a design as they graph a list of linear equations. Their project results in a stained glass window pattern that they color.
EngageNY
Dividing Multi-Digit Numbers Using the Algorithm
Scholars learn to divide multi-digit numbers using the standard algorithm in the 14th installment in a module of 21 parts. They get plenty of practice with the algorithm by completing a worksheet.
EngageNY
Understanding Box Plots
Scholars apply the concepts of box plots and dot plots to summarize and describe data distributions. They use the data displays to compare sets of data and determine numerical summaries.
EngageNY
Connecting Graphical Representations and Numerical Summaries
Which graph belongs to which summary statistics? Class members build upon their knowledge of data displays and numerical summaries to connect the two. Pupils make connections between different graphical displays of the same data in...
EngageNY
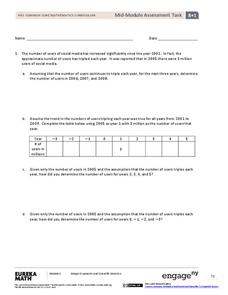
Mid-Module Assessment Task: Grade 8 Module 1
Assess your young mathematicians' knowledge and understanding of the properties of exponents. The questions in the seventh lesson of 15 incorporate the properties learned in the first six modules of this series. Individuals use and apply...
Virginia Department of Education
Permutations and Combinations
Counting is not all it adds up to be — sometimes it involves multiplying. The lesson introduces permutations and combinations as ways of counting, depending upon whether order is important. Pupils learn about factorials and the formulas...
Virginia Department of Education
Graphs
Examine different types of graphs as a means for analyzing data. Math scholars identify the type of graph from a series of data displays and then develop questions to match each one. Then, given a scatter plot of height versus age...

