Texas Education Agency
Texas Gateway:analyzing Effects of the Changes in M and B on the Graph of Y=mx+b
Given algebraic, graphical, or verbal representations of linear functions, the studnet will determine the effects on the graph of the parent function f(x) = x.
Texas Education Agency
Texas Gateway: Solving Systems of Equations With Graphs
Given verbal and/or algebraic descriptions of situations involving systems of linear equations, the student will solve the system of equations using graphs. Incorporates GeoGebra applets.
Texas Education Agency
Texas Gateway: Determining Parent Functions (Verbal/graph)
Given a graph or verbal description of a function, the student will determine whether the parent function is quadratic or linear.
Texas Education Agency
Texas Gateway: Determining the Domain and Range for Linear Functions
Given a real-world situation that can be modeled by a linear function or a graph of a linear function, the student will determine and represent the reasonable domain and range of the linear function using inequalities.
Texas Education Agency
Texas Gateway: Linear Inequalities
This activity provides an opportunity for students to examine how to find solutions to linear inequalities by graphing.
Math Planet
Math Planet: Algebra 1: Linear Equations in the Coordinate Plane
Provides examples and a video lesson that illustrates how to graph a linear equation.
Khan Academy
Khan: Lsn 8: Interpreting Relationships in Scatterplots/graphs/tables/equations
This lesson focuses on Interpreting and analyzing linear, quadratic, and exponential models and graphs. Students will use best fit lines to interpret contexts, distinguish whether contexts are linear or exponential functions, use the...
Illustrative Mathematics
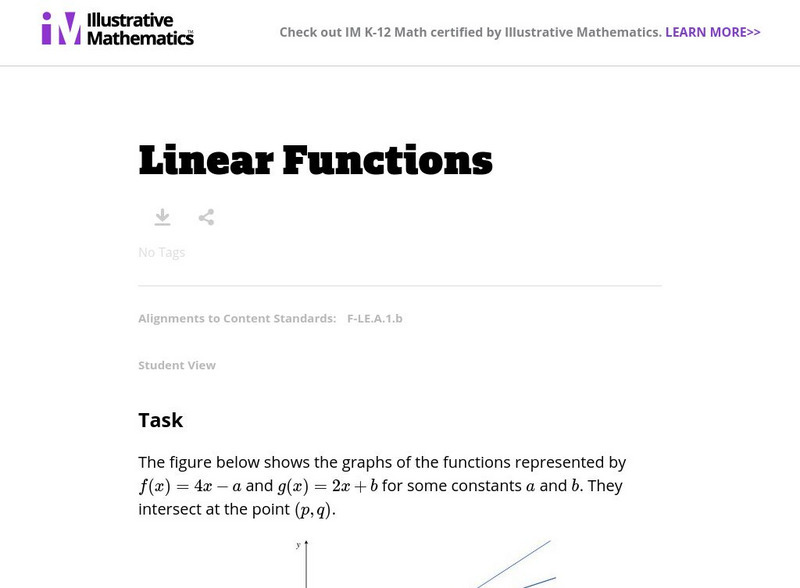
Illustrative Mathematics: F Le Linear Functions
In this problem, learners are presented with the equations of two linear functions and their intersecting graphs. They are asked to label the graphs and compute values for several points on the graphs. Aligns with F-LE.A.1.b.
Oswego City School District
Regents Exam Prep Center: Linear Quadratic Systems
A lesson, practice exercise, and resource for use when planning classroom instruction on linear quadratic systems. Find definitions, example equations and graphs, a four-question quiz with solutions, and an activity through which...
Math Planet
Math Planet: Pre Algebra: Graphing Linear Inequalities
Discover how to graph linear inequalities by taking a look at an example and a video lesson.
CK-12 Foundation
Ck 12: Algebra: Graph Using Intercepts: Graphs of Linear Functions
[Free Registration/Login may be required to access all resource tools.] In this tutorial, students learn to write and evaluate functions and determine if a graph represents a function. They examine guided notes, review guided practice,...
CK-12 Foundation
Ck 12: Algebra: Solve One Step Inequalities: Linear Inequalities
[Free Registration/Login may be required to access all resource tools.] Solve inequalities by isolating the variable and graphing the solution.
PBS
Pbs: Graphing a System of Equations
Solve a number riddle by finding the point of intersection for two lines. This video focuses on finding the solution for a system of equations, they are represented as an algebraic expression and a set of linear equations that are...
Illustrative Mathematics
Illustrative Mathematics: F Bf.3 Transforming the Graph of a Function
This task examines, in a graphical setting, the impact of adding a scalar, multiplying by a scalar, and making a linear substitution of variables on the graph of a function f. There is no formula for the function so the focus is on...
Illustrative Mathematics
Illustrative Mathematics: A apr.b.3 and a apr.b.2: Graphing From Factors Iii
The task has students use the remainder theorem to deduce a linear factor of a cubic polynomial, and then to completely factor the polynomial. Aligns with A-APR.B.3 and A-APR.B.2.
Khan Academy
Khan Academy: Equations & Inequalities Word Problems
HSA-CED.A.1: Interactive resource which create equations and inequalities in one variable and use them to solve problems. Include equations arising from linear and quadratic functions, and simple rational and exponential functions....
Illustrative Mathematics
Illustrative Mathematics: F Le, a Rei Population and Food Supply
In this task, young scholars analyze the sizes of a country's population and of its food supply to determine when and if food shortages will occur. To solve it, they must construct and compare linear and exponential functions and find...
Illustrative Mathematics
Illustrative Mathematics: F if Oakland Coliseum
For this task, students are asked to find the domain and range of a linear function in the context of ticket sales at the Oakland Coliseum. Aligns with F-IF.B.5.
Illustrative Mathematics
Illustrative Mathematics: 8.ee Proportional Relationships, Lines, and Equations
In this task, 8th graders are shown the graphs of two lines with the same slope. They are given the equation for the first line and the coordinates of a point on the second and are asked to find the equation for the second line. Aligns...
Student Achievement Partners
Illustrative Mathematics: Equations of Lines [Pdf]
In this instructional activity, students are to interpret graphs with equations of lines.
Cuemath
Cuemath: Constant Functions
This mini-lesson targets the concept of constant functions. Provides a definition, shows graphs, and defines their characteristics along with some solved examples and a few practice questions to test your understanding.
Oswego City School District
Regents Exam Prep Center: Regression Analysis
A collection of lesson ideas, a practice activity, and teacher resources for exploring regression analysis.
Illustrative Mathematics
Illustrative Mathematics: F Bf Building a Quadratic Function From F(x) = X^2
This is the first of a series of tasks aiming at understanding the quadratic formula in a geometric way in terms of the graph of a quadratic function. Here the student works with an explicit function and studies the impact of additive...
Illustrative Mathematics
Illustrative Mathematics: The Intersection of Two Lines
The purpose of this task is to introduce students to systems of equations. It takes skills and concepts that students know up to this point, such as writing the equation of a given line, and uses it to introduce the idea that the...
Other popular searches
- Graphing Linear Equations
- Graphing Linear Inequalities
- Graphing Lines
- Graphing Linear Functions
- Graphs and Linear Equations
- Graphing Linear Systems
- Graph Linear Function
- Graphs of Linear Functions
- Graphing a Linear Equation
- Graph Linear Inequality
- Graphing Nonlinear Functions
- Graph Linear Equations


