Hi, what do you want to do?
Colorado State University
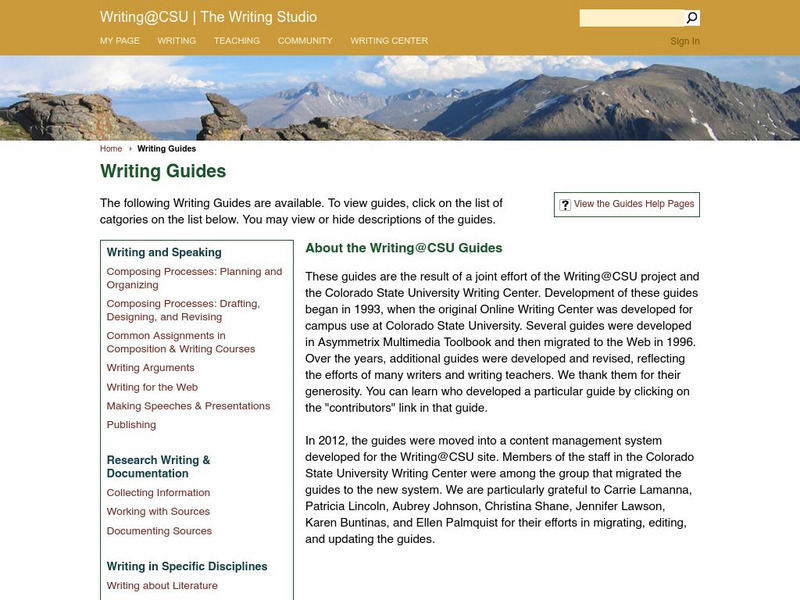
Colorado State Writing Center: Charts
The use of charts and graphs can improve your presentations, whether on paper or as visual aids. Here you can read about how to create line, column, bar, pie graphs, and scatterplots. Just follow the links to their respective pages.
Sophia Learning
Sophia: Using Graphs to Analyze Data
This lesson will demonstrate how to analyze and interpret data given in the form of a graph.
Education Place
Houghton Mifflin: Eduplace: Make a Living Bar Graph
Student use simple data to line up in a living bar graph activity when they respond to simple questions in this lesson plan. They physically and visually represent the data. CCSS.Math.Content.3.MD.B.3 Draw a scaled picture graph and a...
ClassFlow
Class Flow: Graphs
[Free Registration/Login Required] This flipchart is a quick review of line, bar, and circle graphs.
McGraw Hill
Glencoe: Using Graphs to Understand Data Quiz
This is a quiz with five quick questions to check your knowledge of how to use graphs to understand data. It is self-checking.
Texas Education Agency
Texas Gateway: Selecting and Using Representations for Collected Data
[Accessible by TX Educators. Free Registration/Login Required] Given a variety of data (including line plots, line graphs, stem and leaf plots, circle graphs, bar graphs, box and whisker plots, histograms, and Venn diagrams), the student...
Beacon Learning Center
Beacon Learning Center: All That Data
Students analyze data by finding the mean, median, mode, and range of a set of numbers. Line plots, bar graphs, and circle graphs are also included in this lesson.
ClassFlow
Class Flow: Charts Handling Data
[Free Registration/Login Required] Reading graphs fit together with this engaging, colorful flipchart analyzing pie charts, bar graph, percents, and fractions.
Rice University
Rice University: The Hand Squeeze
Students will enjoy this data collection and class analysis experiment involving the time it takes for a hand squeeze to travel around a circle of people. From organizing the activity to collecting the data to making a table and graphing...
The Math League
The Math League: Using Data and Statistics: Pie Charts
This introductory tutorial about statistical graphing with four examples of how pie charts (circle graphs) are constructed and read.
E-learning for Kids
E Learning for Kids: Math: Treasure Island: Interpreting Data
Students will play interactive games to interpret information from different types of graphs.
abcteach
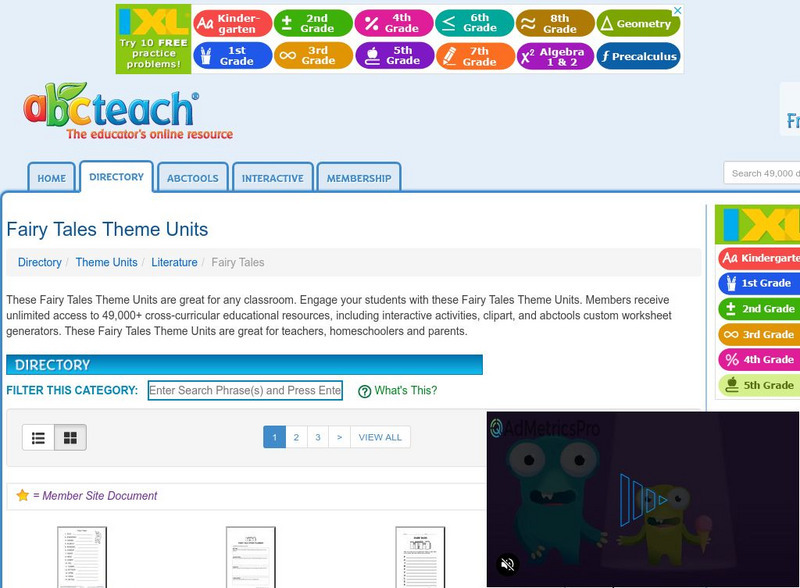
Abcteach: Fairy Tale Printouts: Abc teach.com
[Free Registration/Login Required] This fairy tale resource features activities, bar graphs, word searches, crossword puzzles and more. Teachers can print out many of these materials quickly and easily.
National Council of Teachers of Mathematics
Nctm: Illuminations: Bar Grapher
A computer applet that will draw any bar graph with student's data input.
Varsity Tutors
Varsity Tutors: Hotmath: Practice Problems: Tables and Graphs
Six problems present various aspects of using and making tables and graphs to display statistics. They are given with each step to the solution cleverly revealed one at a time. You can work each step of the problem then click the "View...
PBS
Pbs Mathline: Sand Babies (Pdf) [Pdf]
In this engaging lesson, students use a variety of measurement strategies in creating their own Sand Babies. Students explore standard and non-standard measurements, area, data collection and analysis, and graphing. Adaptations are...
That Quiz
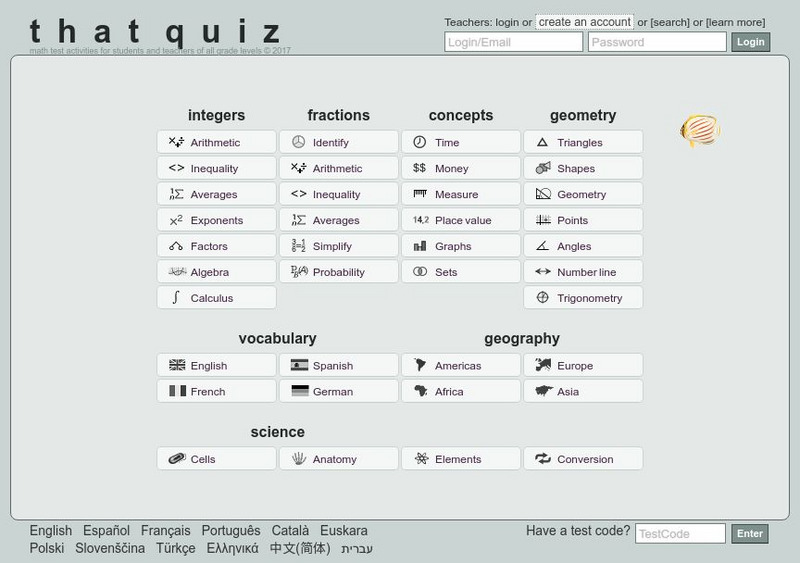
That Quiz
ThatQuiz is an excellent assessment tool for teachers and students. At this site, teachers can create individualized or group assessments on a variety of math topics. Students take these practice assessments directly online and receive...
The World Bank
World Bank: Poulation, Total
This site from the World Bank provides data on population for most of the countries of the world in 2020, and shows the change in the rate from 1960 to 2020. Statistics are presented in a chart, line graph, bar graph, and map. The data...
The World Bank
World Bank: Mortality Rate, Infant (Per 1,000 Live Births)
This site from the World Bank provides data on infant mortality for most of the countries of the world in 2020, and shows the change in the rate from 1960 to 2020. Statistics are presented in a chart, line graph, bar graph, and map. The...
Cuemath
Cuemath: Data Handling
This comprehensive guide about data handling helps with understanding how the study of data handling and graphical representation of the data along with other tools help us in dealing with numerical data. Includes solved examples and...
Teachnology
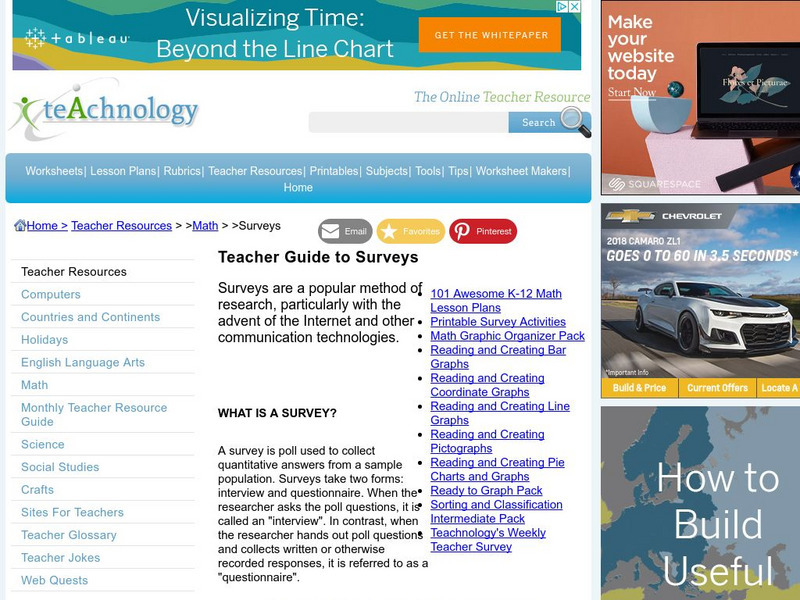
Teachnology: Survey Teaching Theme
Survey Theme provides an excellent collection of free sample worksheets, teacher resources, lesson plans and interactive media for grades k-12.
Teachnology
Teachnology: Survey Teaching Theme
Survey Theme provides an excellent collection of free sample worksheets, teacher resources, lesson plans and interactive media for grades k-12.
Council for Economic Education
Econ Ed Link: Who Is Working?
This lesson teaches middle schoolers what economists mean when they talk about people who are employed, unemployed, and not in the labor force. It discusses the Current Population Survey and asks students to pose as government survey...
CK-12 Foundation
Ck 12: Types of Data Representation: Graphic Displays of Data
[Free Registration/Login may be required to access all resource tools.] Here you will explore displays of data using bar charts, histograms, pie charts and boxplots, and learn about the differences and similarities between them and how...
Other popular searches
- Bar and Line Graphs
- Bar Circle Line Graph
- Bar Graphs Line Graphs
- Bar, Line, Circle Graphs
- Bar Line Circle Graphs
- Bar Graphs and Line Graphs
- Bar Graphs, Line Graphs
- Bar Line Graphing
- Bar Line Graphs
- Bar Line Graph Unit
- Bar, Line, and Circle Graphs
- Bar & Line Graphs


