Hi, what do you want to do?
TeachEngineering
Teach Engineering: The Challenge Question: "Walk the Line"
Students are introduced to the "Walk the Line" challenge question. They are asked to write journal responses to the question and brainstorm what information they need to answer the question. Ideas are shared with the class (or in pairs...
Khan Academy
Khan Academy: Make Bar Graphs 1
Practice creating bar graphs (bar charts) from data sets. Students receive immediate feedback and have the opportunity to try questions repeatedly, watch a video or receive hints.
Math Is Fun
Math Is Fun: Data Graphs
Create and customize a bar graph, line graph, or pie chart based on a set of data and print it out.
Math Is Fun
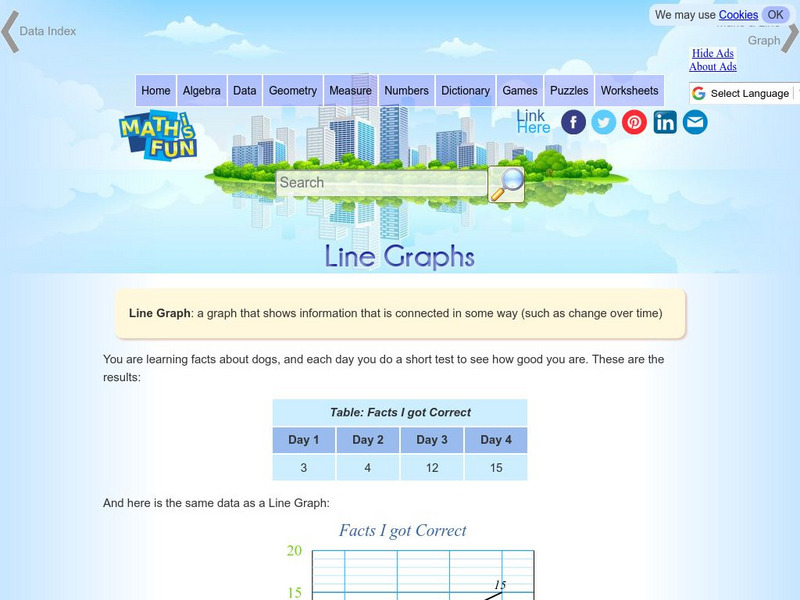
Math Is Fun: Line Graphs
Explains, with examples, what a line graph is and how to construct one. Includes a set of practice questions.
CK-12 Foundation
Ck 12: Graphing
[Free Registration/Login may be required to access all resource tools.] Given a set of data, students will understand how to correctly draw a line or bar graph, interpret its patterns, and find the slope in the case of a line graph.
Quia
Ixl Learning: Line Plots
Brush up on your math skills relating to line plots then try some practice problems to test your understanding.
Texas Education Agency
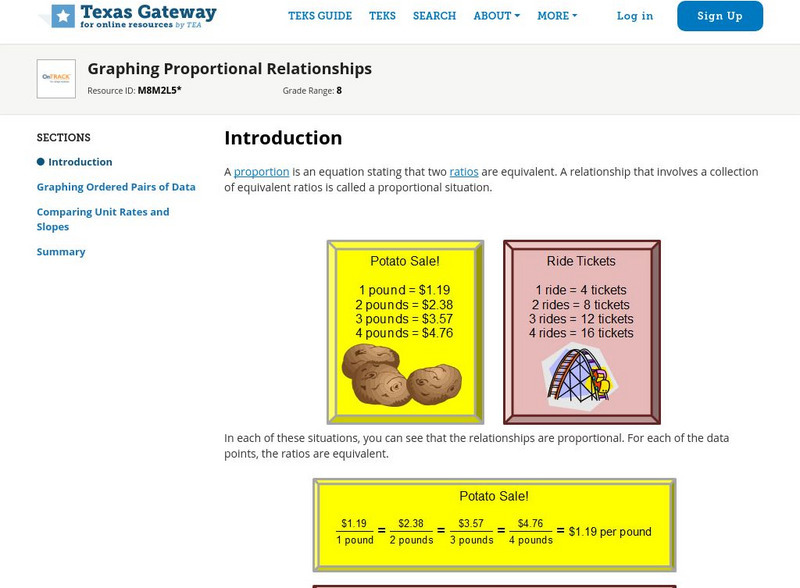
Texas Gateway: Graphing Proportional Relationships
Given a proportional relationship, students will be able to graph a set of data from the relationship and interpret the unit rate as the slope of the line.
Science Education Resource Center at Carleton College
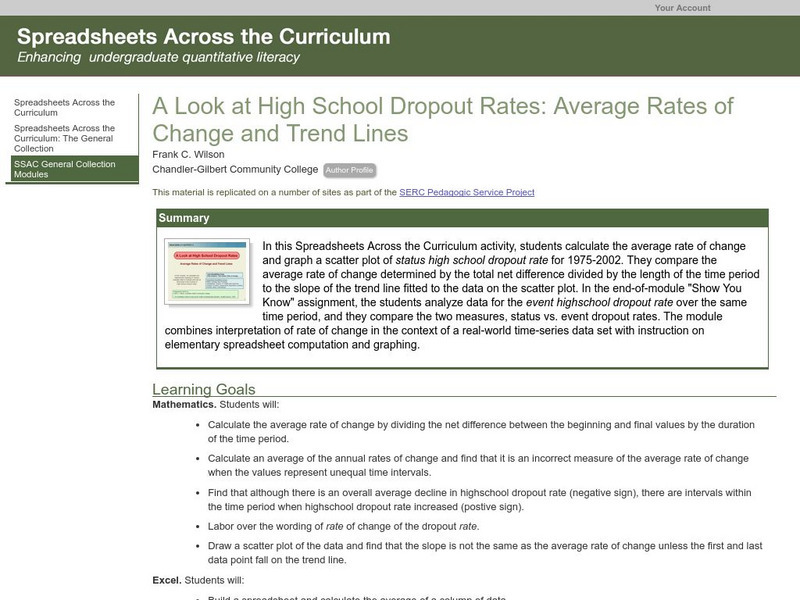
Serc: Average Rates of Change and Trend Lines
In this Spreadsheets Across the Curriculum activity, students calculate the average rate of change and graph a scatter plot of status high school dropout rate for 1975-2002. The module combines interpretation of rate of change in the...
Texas Instruments
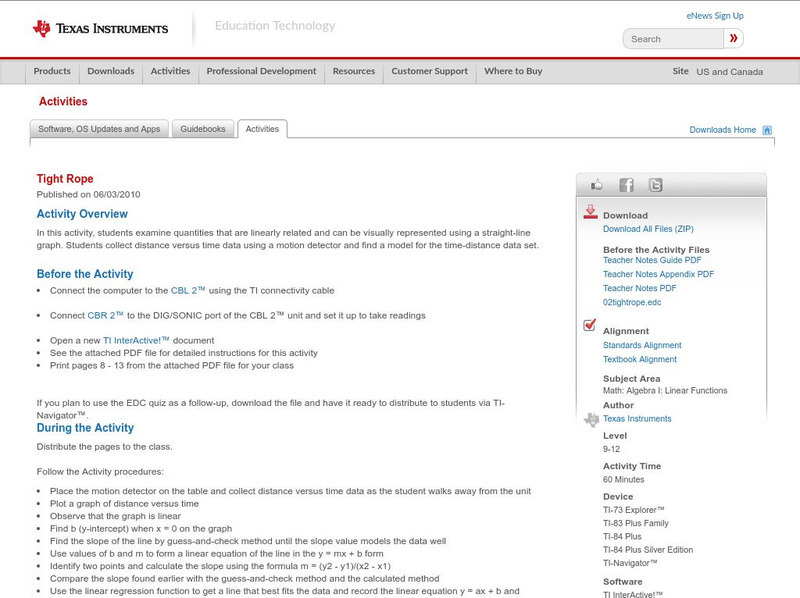
Texas Instruments: Tight Rope
In this activity, students examine quantities that are linearly related and can be visually represented using a straight-line graph. Students collect distance versus time data using a motion detector and find a model for the...
Texas Instruments
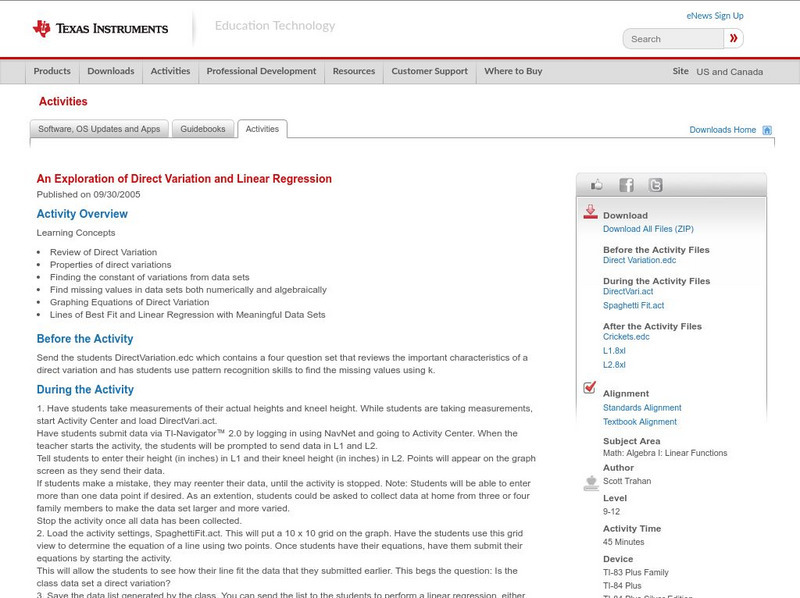
Texas Instruments: An Exploration of Direct Variation and Linear Regression
Students will use this activity for the following Algebra concepts: Review of Direct Variation; Properties of direct variations; Finding the constant of variations from data sets; Find missing values in data sets both numerically and...
Quia
Ixl Learning: Dot Plots
Brush up on your math skills relating to dot plots then try some practice problems to test your understanding.
Texas Instruments
Texas Instruments: Numb3 Rs: Less Is More
Based off of the hit television show NUMB3RS, this two-part lesson begins by having students try to find the line of best fit for a given set of data (strike outs vs. home runs). The second part of the lesson shows how least squares...
Texas Instruments
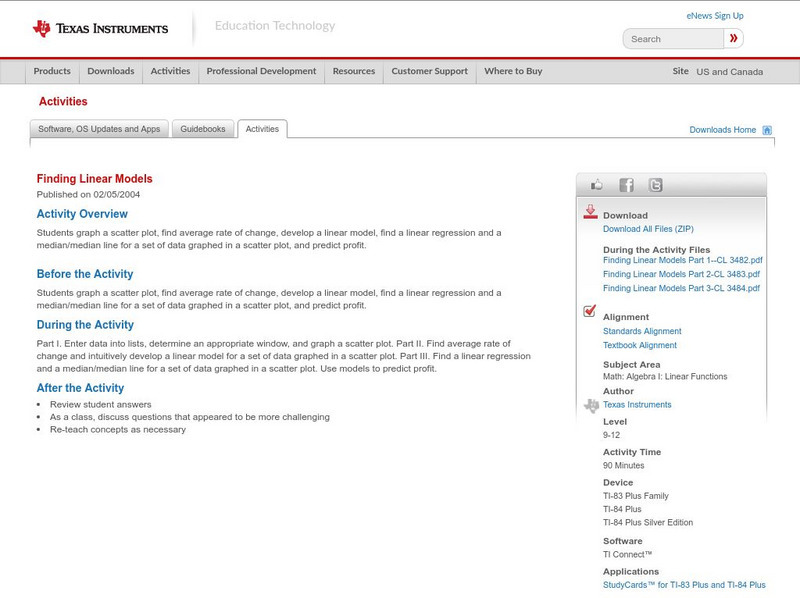
Texas Instruments: Finding Linear Models
Students graph a scatter plot, find average rate of change, develop a linear model, find a linear regression and a median/median line for a set of data graphed in a scatter plot and predict profit.


