Scholastic
Scholastic: Bars, Lines, and Pies
Middle schoolers will learn and reinforce skills for creating, applying and analyzing pie charts, bar graphs and line graphs.
US Department of Education
National Center for Education Statistics: Create a Graph Tutorial
This tutorial walks students through how to create different types of graphs using the Create a Graph tool available on the website. Covers bar graphs, line graphs, pie charts, area graphs, scatter plots, and dependent and independent...
Oswego City School District
Regents Exam Prep Center: Scatter Plots and Line of Best Fit
Use this lesson, practice exercise, and teacher resource in planning instruction on scatter plots and line of best fit. In the lessons, you'll find definitions and examples of ways to make a scatter plot, determine correlations, and find...
Cuemath
Cuemath: Linear Graph
A comprehensive guide for learning all about linear graphs with definitions, properties, their equations, how to plot or analyze them, solved examples, and practice questions.
Texas Education Agency
Texas Gateway: Collecting Data and Making Predictions
Given an experimental situation, the student will write linear functions that provide a reasonable fit to data to estimate the solutions and make predictions.
CK-12 Foundation
Ck 12: Types of Data Representation: Graphic Displays of Data
[Free Registration/Login may be required to access all resource tools.] Here you will explore displays of data using bar charts, histograms, pie charts and boxplots, and learn about the differences and similarities between them and how...
Other
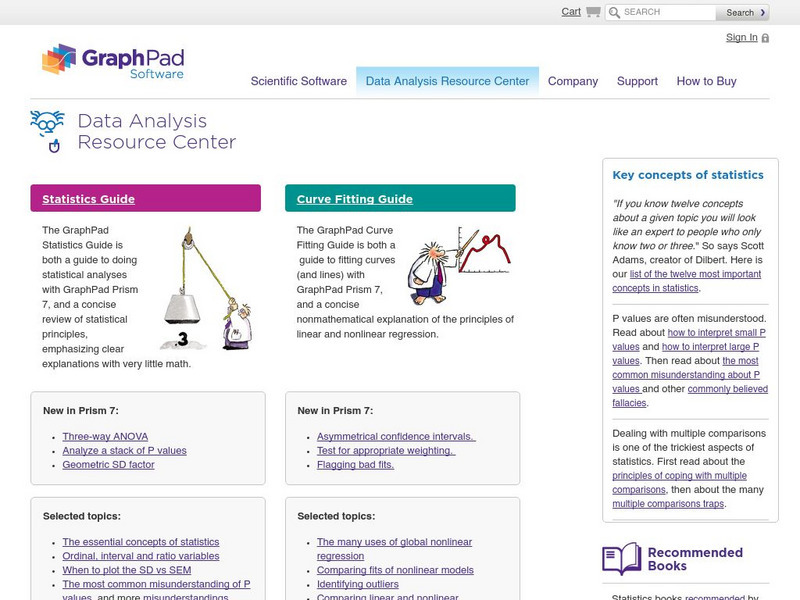
Graph Pad: Data Analysis Resource Center
The GraphPad Statistics Guide is both a guide to doing statistical analyses with GraphPad Prism 7, and a concise review of statistical principles, emphasizing clear explanations with very little math. The GraphPad Curve Fitting Guide is...
Better Lesson
Better Lesson: Jumping Into Math, Measurement, & Data Day 1
Third graders apply measurement, graphing, and data skills to the real world context of physical education with standing jumps.
Annenberg Foundation
Annenberg Learner: Making a Stem and Leaf Plot
A line plot may not be a useful graph for investigating variation so we must come up with a new representation based on groups of data. Construct a stem and leaf plot from a set of 26 data values.
Math Drills
Math Drills: Statistics and Probability Worksheets
Download these free worksheets to sharpen your skills with statistics and probability. Sheets focus on collecting and organizing data, measures of central tendency (mean, median, mode, and range), and probability.
Illustrative Mathematics
Illustrative Mathematics: F Bf Latitude
For this task, students are presented with data about latitude and the percentage of the Earth's surface north of each latitude line. They are to use this data to sketch a graph, analyze it, and build an understanding of an invertible...
Better Lesson
Better Lesson: Sets of Things
Multiplication sounds cool to second graders, but we have to know what it is first. Creating and counting sets is one way to get there.


