Curated OER
Chapter Books
In this line plot worksheet, learners create a line plot of the chapter books read by the students of a class and find the median and mode. Learners complete 3 tasks.
Curated OER
Walking on Air
Students collect and analyze data with a graph. In this statistics instructional activity, students use central tendencies to find the meaning of their data. They display the data on a Ti calculator.
Curated OER
Angles and Arcs
In this angles and arcs worksheet, 10th graders solve 18 various types of problems related to determine various angles and arcs of a circle. First, they find the measure of each angle and arc of the first circle shown. Then, students...
Curated OER
Statistics
In this statistics worksheet, students view 6 graphs to determine the correlation. Students then answer 4 questions that involve plotting data, determining a relationship, and making predictions.
Curated OER
Mean, Median, Mode, and Range: Reteach
In this line plots worksheet, students review how to make a line plot to show data and review the steps to find mean, median, mode, and range. Students then make a line plot for the data in exercise 1 and use it to answer the remaining...
Curated OER
Graphing Linear Equations
Students graph linear equations. In this algebra instructional activity, students solve linear equations and graph it on a coordinate plane. They evaluate integers using linear equations.
Curated OER
Temperature
Young scholars explore the concept of temperature. In this temperature lesson, students read thermometers in degrees Celsius. Young scholars discuss the temperature of the seasons and what clothing they might wear given a certain...
Curated OER
Scatter Plots
In this scatter plots worksheet, students solve and complete 4 different problems. First, they use the table shown to model the relation with a scatter plot and trend line and to predict the value of a variable when given the other...
Curated OER
The Numbers Behind Hunger: Rate of Change
Explore the concept of world hunger by having students collect and graph 1990 world hunger statistics. They will analyze the data in order to determine how to decrease world hunger rates and try to determine problems and solutions of...
Curated OER
Statistics
In this statistics worksheet, 9th graders solve and complete 5 different word problems that include different data. First, they determine if there is an explanatory and a response variable in the given data set. Then, students create a...
Curated OER
Scatterplots
In this scatterplots learning exercise, students construct a scatter plot from a given data set. Students then answer 4 questions regarding the least-squares regression line and making predictions.
Curated OER
Untraceable Exercise
In this tracing worksheet, learners trace lines, figures, and letters and explain if they could or could not trace them. Students complete 9 problems.
Curated OER
The Koch Snowflake: Measuring and Area
In this snowflakes worksheet, learners cut out the given snowflakes and place them on graph paper to solve problems such as area and measurement. Students do this for 6 snowflakes.
Curated OER
Compound Inequalities
In this algebra worksheet, 11th graders solve compound inequalities and graph their solution on a number line. There are 6 questions with an answer key.
Curated OER
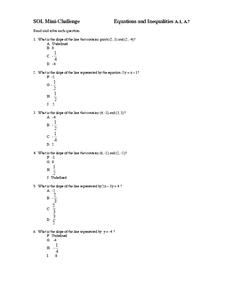
Equations and Inequalities
In this equations and inequalities worksheet, 9th graders solve and graph 10 different problems that include determining the slope of a line in each. First, they determine the line that contains given points on a grid. Then, students...
Curated OER
Solving Open Sentences Involving Absolute Value
In this math worksheet, students solve 6 open sentences and graph solutions using a line graph. Students then express 2 story problems in terms of inequalities. Students then write open sentences for 2 graphs.
Curated OER
Inverse Functions
In this inverse functions worksheet, 9th graders solve and graph 10 different problems that include the inverse of various functions. First, they determine if the coordinates given is the inverse of a function given. Then, students use...
Curated OER
1 Inch Graph
In this math activity, students use the 1 inch box graph. They record data and create a line graph according to the class activity. There are two copies of the graph.
Mixing In Math
Mixing in Math: Growing Plants
Whether you have your class plant seeds or begin when sprouts are visible, math skills are used here to predict and track growth over time. Straw bar graphs show plant height on a given day while the graph as a whole shows changes over...
Curated OER
Water: From Neglect to Respect
The goal of this collection of lessons is to make middle schoolers more aware of the ways in which they are dependent upon water to maintain their standard of living. Learners compare water use in Lesotho to water use in the United...
Sri Atmananda Memorial School
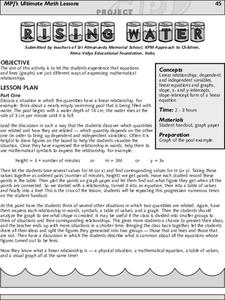
Rising Water
An engaging, and not to mention attractive, lesson plan has prealgebra and beginning algebra scholars examining linear relationships. They consider the rising water level as a swimming pool is being filled. They do so by charting and...
Curated OER
Study Guide: Rational Numbers
In this rational numbers worksheet, students solve and complete 8 different problems that include applying the comparison property and density property for rational numbers. First, they replace each blank with the correct symbol to make...
Illustrative Mathematics
Robot Races
Analyze data on a graph to answer three questions after a robot race. Learners practice comparing ratios and reading points on a graph. Answers may vary on the last question based on accuracy of graphing. Use the lesson along with three...
Illustrative Mathematics
Fishing Adventures 1
Often inequalities exist in many real-world contexts but young math learners struggle with understanding how to represent that relationship in a simple equation using an inequality. This activity focuses on the basic concepts by using...
Other popular searches
- Double Line Graphs
- Graphs. Line Graphs
- Bar and Line Graphs
- Interpreting Line Graphs
- Making Line Graphs
- Reading Line Graphs
- Analyzing Line Graphs
- Creating Line Graphs
- Number Line Graphs
- Reading Double Line Graphs
- Straight Line Graphs
- Bar Graphs Line Graphs


