Federal Reserve Bank
Would Increasing the Minimum Wage Reduce Poverty?
Here is a fantastic and relevant question to discuss with your class members. Using detailed reading material and a related worksheet, your learners will learn about labor markets, equilibrium wages, price floors, and who exactly would...
Curated OER
Creating Line Graphs
High schoolers draw line graphs. In this math lesson, students interpret minimum wage data and graph the data in a line graph. High schoolers predict the next minimum wage and figure the earnings for a 40 hour work week for someone...
Curated OER
Creating Line Graphs
Students relate data to coordinate graphs and plot points on this graph. They use minimum wage data to construct the graph. Students decide appropriate time intervals for the graphs. They share graphs with their classmates.
Curated OER
Lines of Fit
Students graph an equation and analyze the data. In this algebra lesson, students graph scatter plots and identify the line of best fit using positive correlation, negative correlation an d no correlation. They apply their data analysis...
Law for Kids
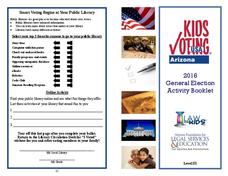
General Election Activity Booklet
It's never too early to practice smart voting! Gain practice voting in a general election using a booklet compiled of an assortment of activities including a word search, maze, graphing, and more!
Curated OER
Using Inequalities to Problem Solve
Students explore inequalities. In this Algebra I instructional activity, students solve and graph linear inequalities involving addition, subtraction, multiplication, or division. Students use inequalities to solve and graph real-world...


