Other
National Security Agency: Line Plots: Frogs in Flight [Pdf]
Students learn how to construct and interpret line plots. The lesson plan describes an activity that has students collect data, create line plots, and interpret and analyze the data.
Annenberg Foundation
Annenberg Learner: Making a Stem and Leaf Plot
A line plot may not be a useful graph for investigating variation so we must come up with a new representation based on groups of data. Construct a stem and leaf plot from a set of 26 data values.
Math Planet
Math Planet: Stem and Leaf Plots and Box and Whiskers Plot
Discover how to use stem-and-leaf plots and box-and-whisker plots to visualize data by taking a look at examples and a video lesson.
Oswego City School District
Regents Exam Prep Center: Scatter Plots and Line of Best Fit
Use this lesson, practice exercise, and teacher resource in planning instruction on scatter plots and line of best fit. In the lessons, you'll find definitions and examples of ways to make a scatter plot, determine correlations, and find...
University of Regina (Canada)
University of Regina: Math Central: Scatter Plots
Three different concepts are examined about scatter plots. Topics featured are collecting data, analyzing scatter plots, and determining a line of "best fit". The lesson plan has an overview, material, procedures, and evaluation techniques.
Illustrative Mathematics
Illustrative Mathematics: 2.md the Longest Walk
In this lesson plan students will measure different points on the map and create a line plot from those measurements.
University of Georgia
University of Georgia: Inter Math: Box and Whisker Plot
Description of box-and-whisker plots and their uses, along with a visual representation. There are links to related terms, everyday examples, more information, and the interactive checkpoint involving box and whisker plots located in the...
University of Regina (Canada)
University of Regina: Math Central: Scatter Plots
Three different concepts are examined about scatter plots. Topics featured are collecting data, analyzing scatter plots, and determining a line of "best fit". The lesson has an overview, material, procedures, and evaluation techniques.
University of Regina (Canada)
University of Regina: Math Central: Quiz Equation of a Line
Quiz on plotting equations, slope and intercepts, equation of a line, and special lines.
University of Regina (Canada)
University of Regina: Math Central: Quiz Equation of a Line
Quiz on plotting equations, slope and intercepts, equation of a line, and special lines.
University of Regina (Canada)
University of Regina: Math Central: Quiz Equation of a Line
Quiz on plotting equations, slope and intercepts, equation of a line, and special lines.
Illustrative Mathematics
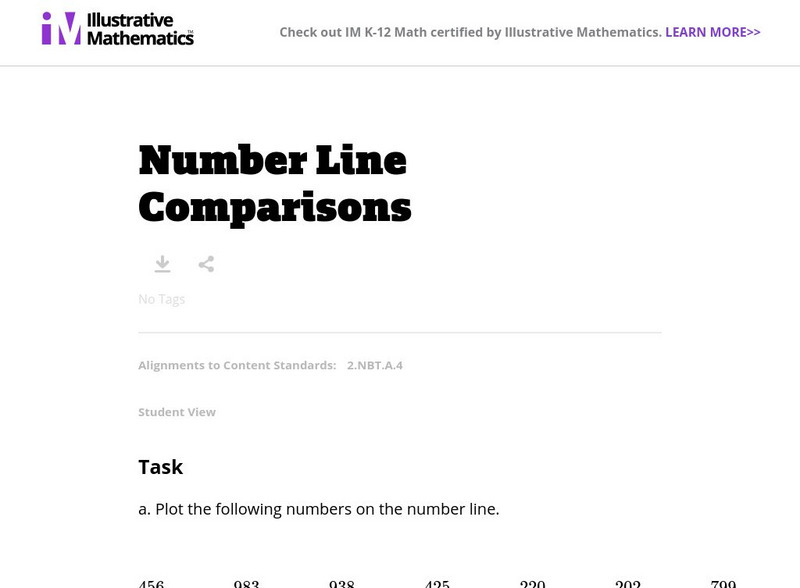
Illustrative Mathematics: 2.nbt Number Line Comparisons
In this lesson plan students are given numbers to plot on a number line then choose numbers to compare.
Better Lesson
Better Lesson: Jumping Into Math, Measurement & Data Day 2
Third graders create line plots and analyze data using measurement data with quarter unit fractions.
University of Illinois
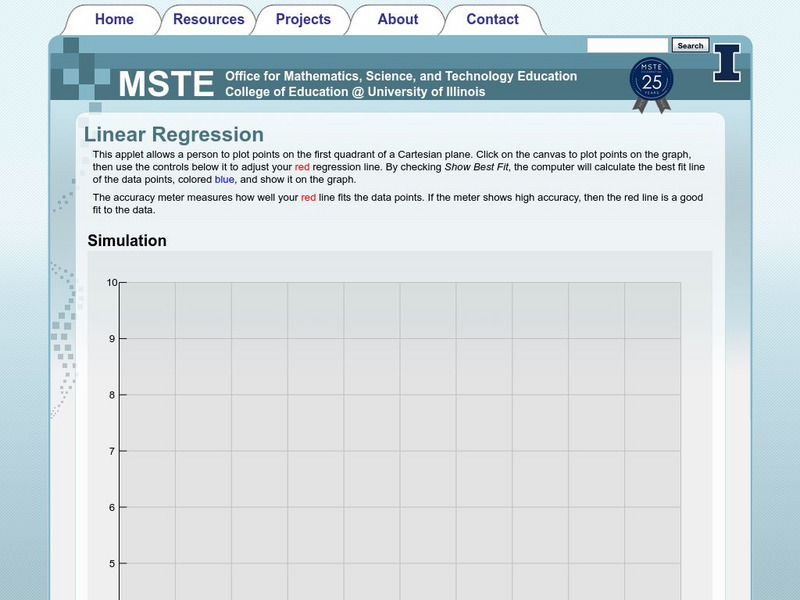
University of Illinois: Linear Regression Applet
This applet allows you to plot up to fifty points and it will display a best fit line and give you the slope of that line.
Better Lesson
Better Lesson: Coordinate Grid and Geometry
Learners make connections between the coordinate grid and Geometry by finding the distance of line segments using the coordinate plane. This lesson includes a detailed lesson plan, slides containing notes and problems, and a...
CK-12 Foundation
Ck 12: Types of Data Representation: Graphic Displays of Data
[Free Registration/Login may be required to access all resource tools.] Here you will explore displays of data using bar charts, histograms, pie charts and boxplots, and learn about the differences and similarities between them and how...
US Department of Education
National Center for Education Statistics: Create a Graph Tutorial
This tutorial walks students through how to create different types of graphs using the Create a Graph tool available on the website. Covers bar graphs, line graphs, pie charts, area graphs, scatter plots, and dependent and independent...
Duke University
Duke University: Web Feats Ii: Lessons on Regression at Hessian
This site has several lessons on regression, "Designed to help students visualize topics associated with lines of regression, given a set of data points." Go to the teacher notes to find the objectives and standards which apply.
Cuemath
Cuemath: Linear Graph
A comprehensive guide for learning all about linear graphs with definitions, properties, their equations, how to plot or analyze them, solved examples, and practice questions.
Washington State University
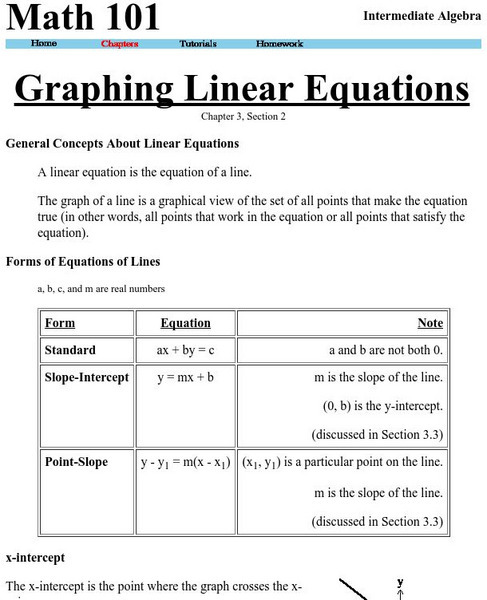
Washington State University: Graphing Linear Equations
This site explains what a linear equation is, general forms of linear equations, how to graph a line using the method of plotting points. The site also details how to find points on the line given the equation, information about the...
TeachEngineering
Teach Engineering: Graphing the Rainbow
Students are introduced to different ways of displaying visual spectra, including colored "barcode" spectra, like those produced by a diffraction grating, and line plots displaying intensity versus color, or wavelength. Students learn...
Texas Education Agency
Texas Gateway: Collecting Data and Making Predictions
Given an experimental situation, the student will write linear functions that provide a reasonable fit to data to estimate the solutions and make predictions.
Other popular searches
- Line Plot Worksheets
- Frequency Tables Line Plots
- Line Plot Graphs
- 1st Grade Line Plot
- Free Line Plot
- Line Plot Pictures
- Frequency Table Line Plot
- Plot Line
- Line Plots Grade 3
- Scatter Plot Trend Line
- Line Plot Outliers
- Fraction Line Plot
![National Security Agency: Line Plots: Frogs in Flight [Pdf] Lesson Plan National Security Agency: Line Plots: Frogs in Flight [Pdf] Lesson Plan](https://content.lessonplanet.com/knovation/original/122495-587001a487c71ef32e76fdab66ff794e.jpg?1661494304)

