Khan Academy
Khan Academy: Read Line Plots (Data With Fractions)
Practice reading and interpreting data that is graphed on line plots. The data graphed includes fractions. Students receive immediate feedback and have the opportunity to try questions repeatedly, watch a video or receive hints....
CK-12 Foundation
Ck 12: Statistics: Line Plots From Frequency Tables
[Free Registration/Login may be required to access all resource tools.] Create a line plot given data organized in a frequency table.
Other
Mr maffesoli.com: Line Plot Worksheet C [Pdf]
Fifth graders will complete questions on a worksheet about line plots and will also create a line plot from given information.
Other
Mr maffesoli.com: Line Plot Worksheet B [Pdf]
Fifth graders will be given line plots about gummy candies and other topics that they will use to answer questions.
McGraw Hill
Glencoe: Self Check Quizzes 2 Line Plots
Use Glencoe's Math Course 2 randomly generated self-checking quiz to test your knowledge of line plots. Each question has a "Hint" link to help. Choose the correct answer for each problem. At the bottom of the page click the "Check It"...
Khan Academy
Khan Academy: Line Plots Review
Reviews what line plots are and how to make them. Includes some practice problems with explanations of the solutions.
Annenberg Foundation
Annenberg Learner: Creating a Line Plot
Watch as a physical stack of coins is added as a series of dots to a line plot.
Khan Academy
Khan Academy: Graph Data on Line Plots
Record measurements on line plots (also called dot plots). Students receive immediate feedback and have the opportunity to try questions repeatedly, watch a video or receive hints.
Khan Academy
Khan Academy: Practice: Make Line Plots
A practice quiz where students construct line plots using the information given in the problems. Includes hints.
Quia
Ixl Learning: Line Plots
Brush up on your math skills relating to line plots then try some practice problems to test your understanding.
Illustrative Mathematics
Illustrative Mathematics: Fractions on a Line Plot
Students will play a game with a partner to create a line plot with fractions.
Other
Mr maffesoli.com: Line Plot Worksheet D [Pdf]
Fifth graders will interpret line plot information to answer questions and create a line plot.
Other
Mr maffesoli.com: Line Plot Worksheet E [Pdf]
Fifth graders will interpret data from a line plot and will create a line plot from given information.
Other
Mr Maffesoli: Line Plot Worksheet F: Study Guide and Intervention [Pdf]
Fifth graders will complete a study guide and create a line plot.
Other
Mr maffesoli.com: Line Plot Worksheet H [Pdf]
Fifth graders will create line plots based upon the given information in the tables.
Other
Mr maffesoli.com: Line Plot Worksheet I [Pdf]
Fifth graders will answer word problems from information on a line plot.
Other
Mr maffesoli.com: Line Plot Worksheet G [Pdf]
Fifth graders will complete a activity on interpreting and creating line plots.
Other
Mr maffesoli.com: Line Plot Review [Pdf]
Fifth graders will follow the guidelines to create a line plot from the given information.
Varsity Tutors
Varsity Tutors: Hotmath: Algebra Review: Line Plot
Find a quick, concise explanation of a line plot. An example is given and clearly explained.
Texas Instruments
Texas Instruments: Box Plots: How Many Pairs of Socks
The purpose of this lesson is to help students use the shape of a line plot to interpret the shape of a box plot.
Other
Northern Michigan University: Line Plots
The author utilizes a line plot to demonstrate what an "outlier" is, what "clusters" are, and what "gaps" are.
Math Is Fun
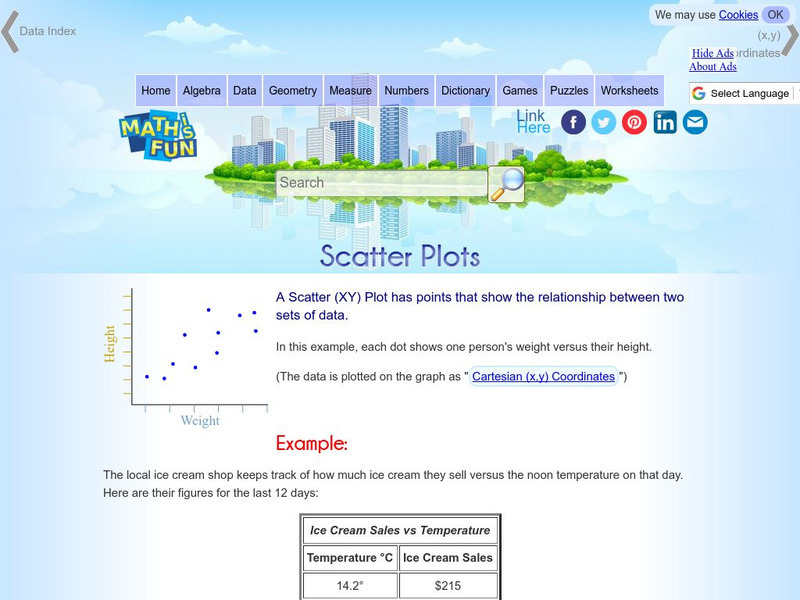
Math Is Fun: Scatter Plots
Explains, with examples, what scatter plots are and how to interpret the data. Discusses trends, interpolation and extrapolation, and correlation. Includes a set of practice questions.
CK-12 Foundation
Ck 12: Statistics: Displaying Bivariate Data
[Free Registration/Login may be required to access all resource tools.] This Concept shows students how to display bivariate data using scatter plots and line plots.
Khan Academy
Khan Academy: Creating Dot Plots
Practice creating dot plots. Dot plots are very similar to frequency tables, but they make it easier to see the data. Students receive immediate feedback and have the opportunity to try questions repeatedly, watch a video or receive hints.
Other popular searches
- Frequency Tables Line Plots
- Line Plots Grade 3
- Math Line Plots
- Christmas Line Plots
- Line Plots and Tallies
- Activities Using Line Plots
- Data Analysis Line Plots
- Human Line Plots
- Ell Math Line Plots
- Line Plots With Airplanes
- Charts, Tables, Line Plots
- Charts Tables Line Plots


![Mr maffesoli.com: Line Plot Worksheet C [Pdf] Unknown Type Mr maffesoli.com: Line Plot Worksheet C [Pdf] Unknown Type](https://content.lessonplanet.com/knovation/original/120988-88ef11e71923fcc1040b64867e5e0c68.jpg?1661814823)
![Mr maffesoli.com: Line Plot Worksheet B [Pdf] Unknown Type Mr maffesoli.com: Line Plot Worksheet B [Pdf] Unknown Type](https://content.lessonplanet.com/knovation/original/120987-067626dba651be86d90a643ffb74f433.jpg?1661814822)


![Mr maffesoli.com: Line Plot Worksheet D [Pdf] Unknown Type Mr maffesoli.com: Line Plot Worksheet D [Pdf] Unknown Type](https://content.lessonplanet.com/knovation/original/120989-ab1c47a6d8c7390c6d5846a2343c47bd.jpg?1661814824)
![Mr maffesoli.com: Line Plot Worksheet E [Pdf] Unknown Type Mr maffesoli.com: Line Plot Worksheet E [Pdf] Unknown Type](https://content.lessonplanet.com/knovation/original/120990-6d40322c5805fa2a20d38b12f5e307a9.jpg?1661814826)
![Mr Maffesoli: Line Plot Worksheet F: Study Guide and Intervention [Pdf] Unknown Type Mr Maffesoli: Line Plot Worksheet F: Study Guide and Intervention [Pdf] Unknown Type](https://content.lessonplanet.com/knovation/original/120991-d3e2569b1cd0f2b9a607650ddd145ee4.jpg?1661814827)
![Mr maffesoli.com: Line Plot Worksheet H [Pdf] Unknown Type Mr maffesoli.com: Line Plot Worksheet H [Pdf] Unknown Type](https://content.lessonplanet.com/knovation/original/120993-3320434c587ac279fc9e9055b3f34841.jpg?1661814829)
![Mr maffesoli.com: Line Plot Worksheet I [Pdf] Unknown Type Mr maffesoli.com: Line Plot Worksheet I [Pdf] Unknown Type](https://content.lessonplanet.com/knovation/original/120994-3f831049567a6f1e296a053ab80385b3.jpg?1661814830)
![Mr maffesoli.com: Line Plot Worksheet G [Pdf] Unknown Type Mr maffesoli.com: Line Plot Worksheet G [Pdf] Unknown Type](https://content.lessonplanet.com/knovation/original/120992-3b83403265c198c6a9d5caa75699cb61.jpg?1661814828)
![Mr maffesoli.com: Line Plot Review [Pdf] Unknown Type Mr maffesoli.com: Line Plot Review [Pdf] Unknown Type](https://content.lessonplanet.com/knovation/original/120995-b4a170e0fbb519748f856045f654f966.jpg?1661814831)


