Hi, what do you want to do?
Texas Instruments
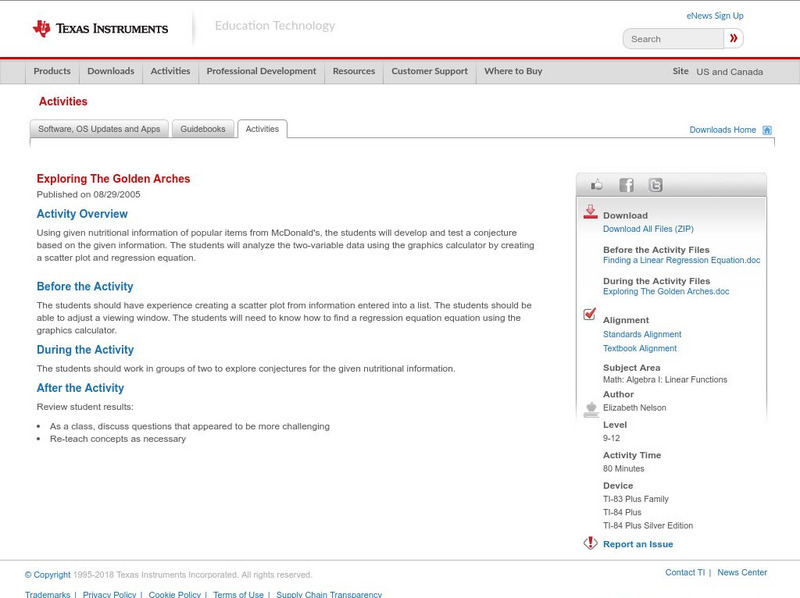
Texas Instruments: Exploring the Golden Arches
Using given nutritional information of popular items from McDonald's, the students will develop and test a conjecture based on the given information. The students will analyze the two-variable data using the graphics calculator by...
Texas Instruments
Texas Instruments: Inverse of Two Temps
In this activity, students find a conversion equation that will calculate the corresponding Celsius temperature for any given Fahrenheit temperature. Students learn to graph scatter plots, analyze and graph linear equations, compute and...
Texas Instruments
Texas Instruments: Chill Out: How Hot Objects Cool
Students use a temperature probe to collect data as the warmed probe cools. Students investigate Newton's law of cooling and model cooling data with an exponential function. They fit the data to a mathematical model after analysis.
Texas Instruments
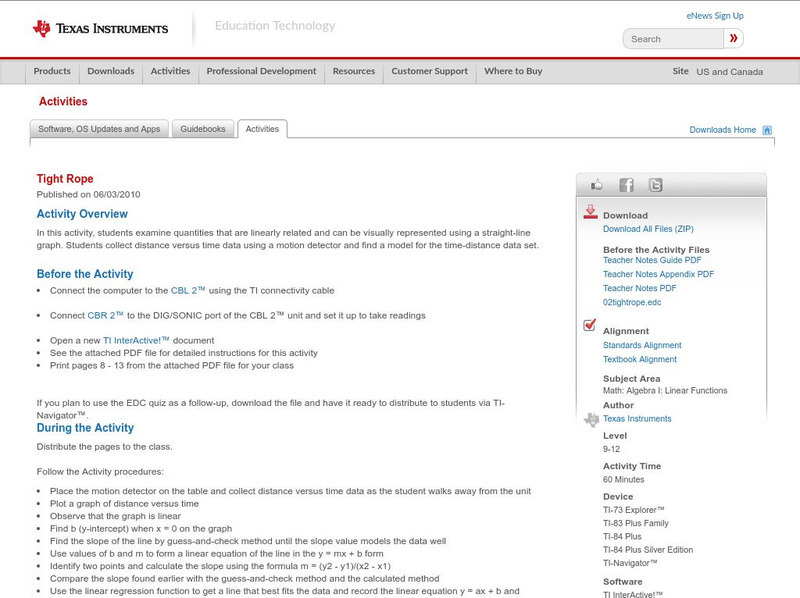
Texas Instruments: Tight Rope
In this activity, students examine quantities that are linearly related and can be visually represented using a straight-line graph. Students collect distance versus time data using a motion detector and find a model for the...
Texas Instruments
Texas Instruments: Stepping to the Greatest Integer: Greatest Integer Function
In this activity, students' will use a motion detector to collect position data showing evenly-spaced jumps in value. They will then model this data using the greatest integer function.
Texas Instruments
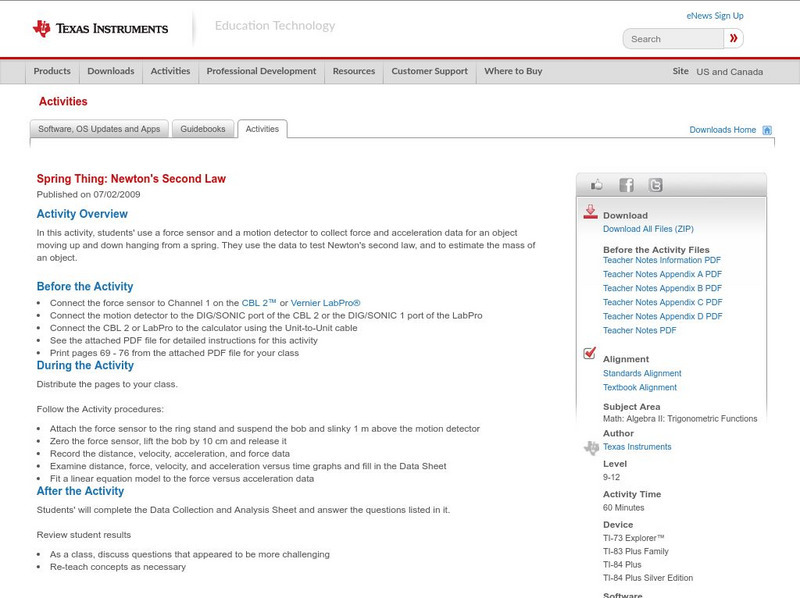
Texas Instruments: Spring Thing: Newton's Second Law
In this activity, students' use a force sensor and a motion detector to collect force and acceleration data for an object moving up and down hanging from a spring. They use the data to test Newton's second law, and to estimate the mass...
Texas Instruments
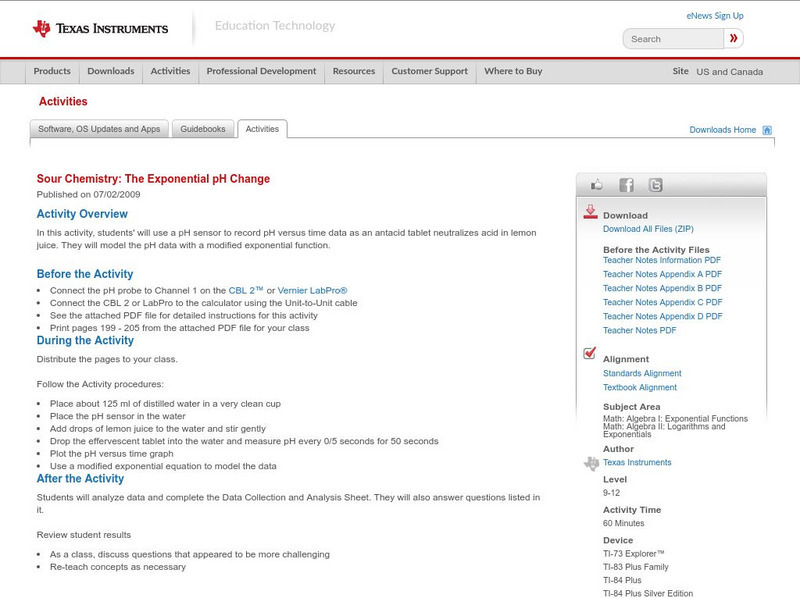
Texas Instruments: Sour Chemistry: The Exponential P H Change
In this activity, students' will use a pH sensor to record pH versus time data as an antacid tablet neutralizes acid in lemon juice. They will model the pH data with a modified exponential function.
Texas Instruments
Texas Instruments: Warming Up to Heating Curves
In this activity, students use the CBL 2 to collect temperature data as a sensor warms up in a cup of water. They find an appropriate mathematical model for the resulting data set.
Texas Instruments
Texas Instruments: Math Today Wildfire Deaths
In this activity, students will be asked to use the "Wildfire deaths" data to determine a linear model. They will examine the affect an outlier has on the model and compare methods to determine the best model.
Texas Instruments
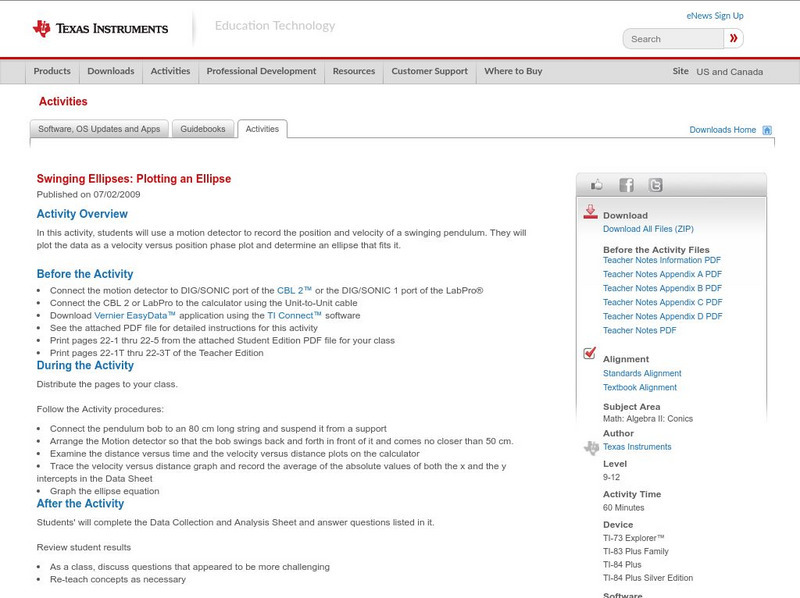
Texas Instruments: Swinging Ellipses: Plotting an Ellipse
In this activity, Students can use a motion detector to record the position and velocity of a swinging pendulum. They will plot the data as a velocity versus position phase plot and determine an ellipse that fits it.
National Council of Teachers of Mathematics
The Math Forum: A Collection of Secondary Math Units
Teachers of grades 9-12 can explore these seven math units for their classes. Data collection and analysis, problem solving with spreadsheets, and linear transformation are just a few of the topics covered here.
Rice University
Rice University: The Hand Squeeze
Students will enjoy this data collection and class analysis experiment involving the time it takes for a hand squeeze to travel around a circle of people. From organizing the activity to collecting the data to making a table and graphing...
CK-12 Foundation
Ck 12: Algebra: Systems Using Substitution
[Free Registration/Login may be required to access all resource tools.] Solve linear systems by using substitution.
Texas Instruments
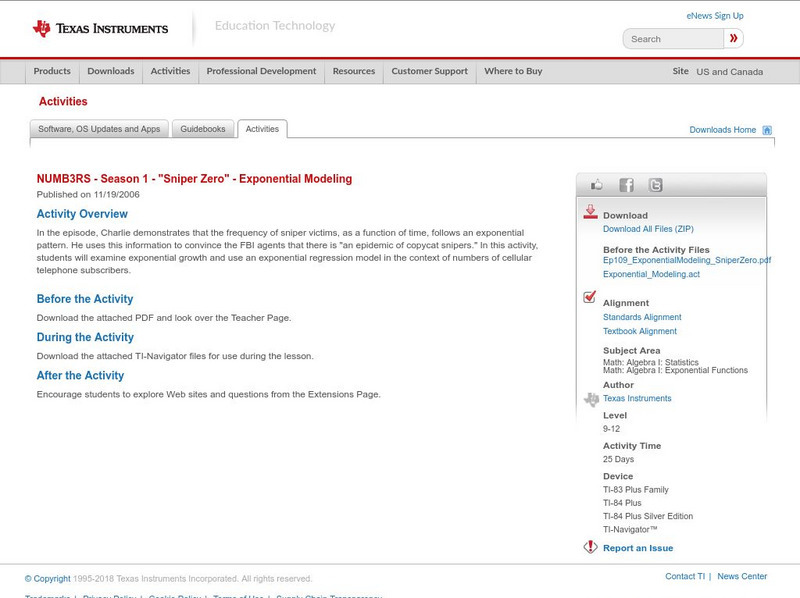
Texas Instruments: Numb3 Rs: Exponential Modeling
Based off of the hit television show NUMB3RS, this lesson introduces students to exponential equations, their graphs, and their application in the real world. The lesson is framed in the context of the number of cell phone users for a...
National Council of Teachers of Mathematics
Nctm: Figure This: Math Challenges for Families
Students, teachers, and parents alike will enjoy this challenging math site. It contains a clever brain teaser section plus creative problems related to algebra, geometry, measurement, numbers, statistics, and probability. A Spanish...
Other
Asl: Heart of Algebra: Chapters 19 21 (Sat and Psat Prep)
Chapter 19 Heart of Algebra focuses on the mastery of linear equations, systems of linear equations, and linear functions. The ability to analyze and create linear equations, inequalities, and functions is essential for success in...
Texas Instruments
Texas Instruments: Home for the Holidays
Thanksgiving Holiday activity for Algebra students. Linear data taken from the internet and used to create a linear model of the class data.Students will then discover the slope of the line is the speed of the car in miles per hour....
Texas Instruments
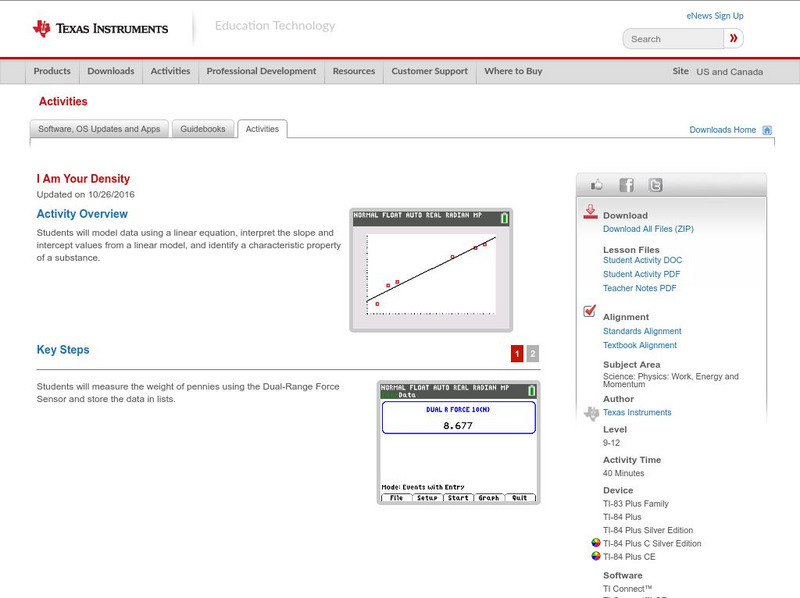
Texas Instruments: I Am Your Density
In this activity you will: Model data using a linear equation; interpret the slope and intercept values from a linear model; identify a characteristic property of a substance; and examine the relationship between mass, volume, and density.
Concord Consortium
Concord Consortium: Smartgraphs: Interpolation
Students explore experimental data of cricket chirping rate to find linear trends on graphs. They use this trend to interpolate values and then find the corresponding linear equations.
Texas Instruments
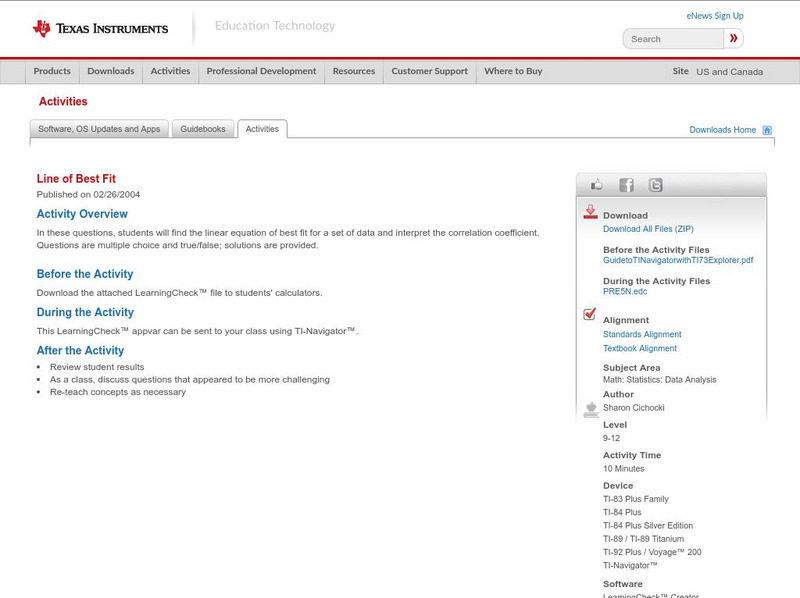
Texas Instruments: Line of Best Fit
In these questions, students will find the linear equation of best fit for a set of data and interpret the correlation coefficient. Questions are multiple-choice and true/false; solutions are provided.
Texas Instruments
Texas Instruments: Muddy Footprints Adventure 11
In this adventure, students will analyze the relationship between height and stride length, and then use that information to identify the biker who left the footprints. They create a scatter plot, find the linear regression equation for...
Texas Instruments
Texas Instruments: Exploring Circles
Explore the relationship between the center and radius of a circle and the equation of the circle. Collect data and determine regression equations related to various combinations of data, and use the regression equations to make...
Texas Instruments
Texas Instruments: A Wet Welcome Home Adventure 4
Students perform an experiment that simulates a leaking pipe and gather data on volume of water lost over time. They graph the data collected as a scatter plot, find the equation of the line of best fit, find the total volume of water...
Texas Instruments
Texas Instruments: A Sweet Drink Adventure 7
Students determine how the temperature of water affects the dissolving time of a sugar cube. They create, interpret and analyze graphs of data, find an equation of the line of best fit, and relate slope to rate of change.


