Hi, what do you want to do?
Illustrative Mathematics
Illustrative Mathematics: F Le Sandia Aerial Tram
For this task, students examine data on the elevation and the minutes into a ride for a tram that is traveling up a mountain and write an equation for the function that models the relationship between the two variables. Aligns with...
Texas Instruments
Texas Instruments: Ball Bounce
This activity allows students to use real data obtained by them to model quadratic equations. students can use the TI-83 and/or TI-84 and a motion detector to collect their data. The students will then manually fit both quadratic and...
Texas Instruments
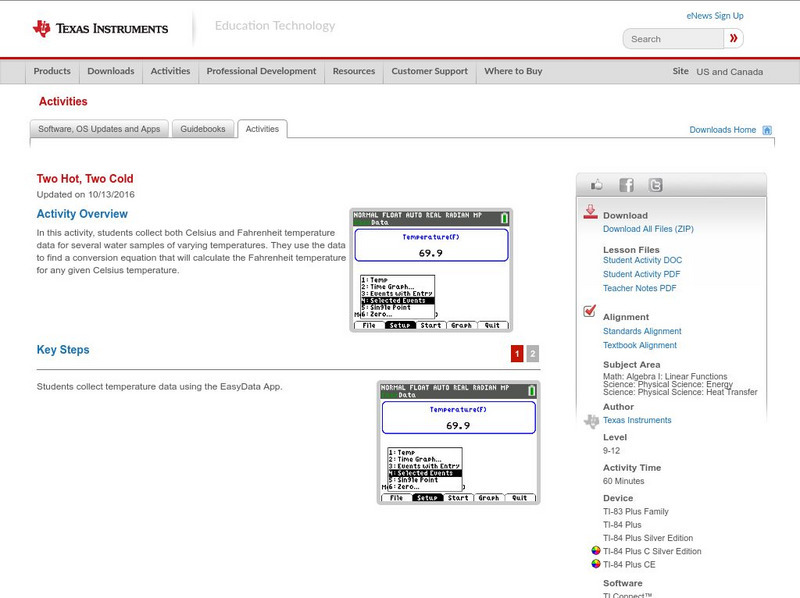
Texas Instruments: Two Hot, Two Cold
In this activity, students collect both Celsius and Fahrenheit temperature data for several water samples of varying temperatures. They use the data to find a conversion equation that will calculate the Fahrenheit temperature for any...
Texas Instruments
Texas Instruments: Women's 5000 M World Record Progression: Median Median Line
In this activity, students will collect the Women's 5000 meter progression of world record data and find the median - median line and the linear regression for the data. They will investigate the appropriateness of each of the models.
Texas Instruments
Texas Instruments: Adding Marbles
Each time students add ten marbles to a container filled with a small amount of water, they measure the height of the water. Students will examine their data and develop linear equations.
Texas Instruments
Texas Instruments: The Phone Bill Problem
The student is given actual data and asked to find a line of best fit and to give "real world" interpretations of the slope and y-intercept. A great introduction to the 83/84 and its features.
Texas Instruments
Texas Instruments: Velocity Test: Interpreting Velocity Graphs
In this activity, students' will use a motion detector to record the distance versus time data for the simple motion of a walker. They will calculate velocity from this graph and compare it with the velocity graph generated by the...
University of Texas at Austin
Mathematics Teks Toolkit: What's Your Rate of Change?
In this lesson, students use an electronic data collector to write the equation of a line.
Texas Instruments
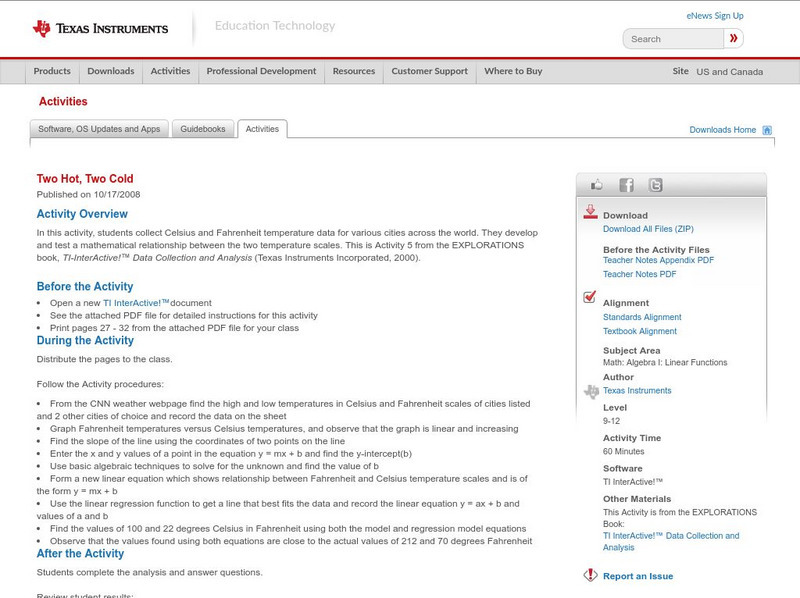
Texas Instruments: Two Hot, Two Cold
In this activity, students collect Celsius and Fahrenheit temperature data for various cities across the world. They develop and test a mathematical relationship between the two temperature scales.
Texas Instruments
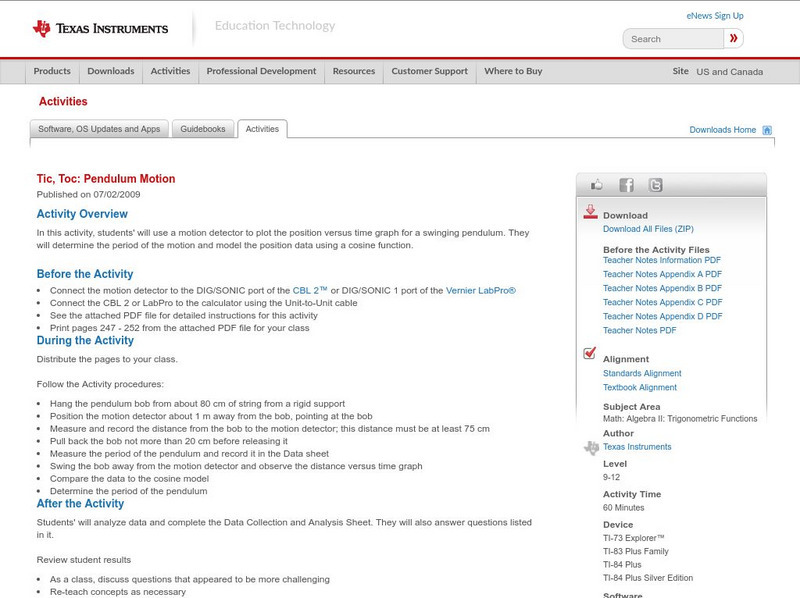
Texas Instruments: Tic, Toc: Pendulum Motion
In this activity, students' will use a motion detector to plot the position versus time graph for a swinging pendulum. They will determine the period of the motion and model the position data using a cosine function.
Texas Instruments
Texas Instruments: Work vs. Leisure
Students can use lists of data and the correlation factor of various regressions to determine the best regression line.
National Council of Teachers of Mathematics
Nctm: Figure This: Gone Fishing (Pdf)
Use your algebraic reasoning to solve this math challenge that explores the relationship between quantities and weights. Try this math challenge from the NCTM Math Challenges for Families series. Also, discover how mastering this skill...
PBS
Pbs Teachers: Weather: Rainfall
Create and use scatterplots based on information from a table, and compare and contrast annual rainfall in various places around the world.
TeachEngineering
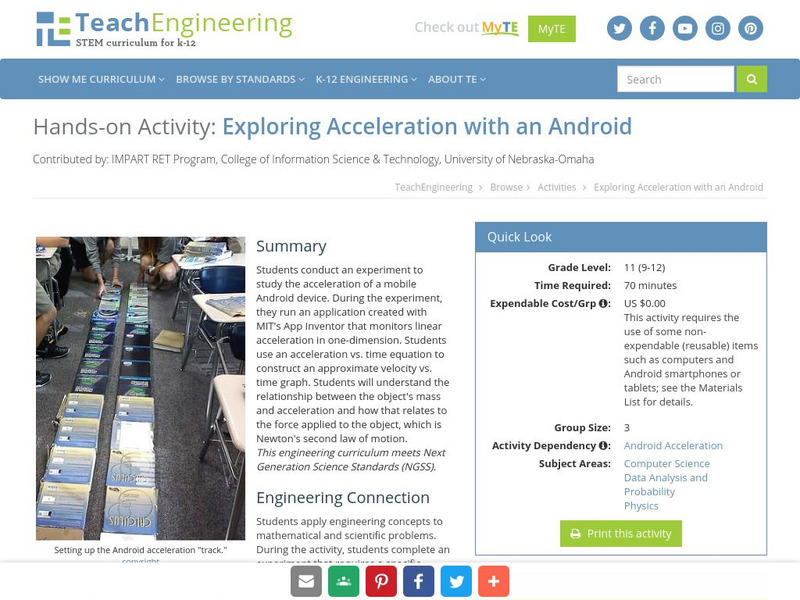
Teach Engineering: Exploring Acceleration With an Android
Students conduct an experiment to study the acceleration of a mobile Android device. During the experiment, they run an application created with MIT's App Inventor that monitors linear acceleration in one-dimension. Students use an...
University of Cambridge
University of Cambridge: Maths and Sports: Project Ideas: World Records
This activity suggests a number of investigative projects, focusing on athletics and swimming, exploring some of the trends between performances in different sports at the same time in history and in the rate of improvement of records...
Richland Community College
Richland Community College: Math 116 Lecture Notes
This site from the Richland Community College provides the detailed lecture notes to a college algebra course, complete with equations and definitions. Content ranges from "functions and their graphs" to "conics and parametric equations."
PBS
Pbs Teachers: Sports and Math: Will Women Athletes Ever Catch and Surpass
Explore, explain and make conclusions based on graphs of scatter plots of the Olympic records for men and women in the same event over the same years. Plot x- and y-values, and create linear equations from the data.
National Council of Teachers of Mathematics
Nctm: Illuminations: Line of Best Fit
Use this applet to learn about a line of best fit for a set of data points. Some example data in this site include statistics from the 2004-2005 LA Lakers season. Students can guess the equation for a set of data points before the applet...
TeachEngineering
Teach Engineering: Forces and Graphing
This activity can be used to explore forces acting on an object, to practice graphing experimental data, and/or to introduce the algebra concepts of slope and intercept of a line. A wooden 2x4 beam is set on top of two scales. Students...
Alabama Learning Exchange
Alex: Bloodstain Pattern Doesn't Lie
Students will formulate a hypothesis about the relationship (linear, direct, indirect, etc.) between the distance a drop of blood falls and the diameter of the splatter it makes. To test their hypothesis, the students will work...
Texas Instruments
Texas Instruments: Math a Review 1
This StudyCards stack enables students to review concepts in algebra, arithmetic, and geometry, in preparation for the Math A Exam held in New York. They solve problems involving scientific notation, factoring, linear equations, rate of...
CK-12 Foundation
Ck 12: Interactive Middle School Math 8 for Ccss
A complete CCSS Grade 8 Mathematics course that includes interactives in every lesson, plus videos, hands-on activities, and questions with immediate feedback. Every lesson also has specifically chosen 'Related Modalities' that teach the...


