Hi, what do you want to do?
Texas Instruments
Texas Instruments: Titration Curves: An Application of the Logistic Function
In this activity, Students can use a pH sensor to record pH versus base volume data for an acid base titration. They will manually model the curve using a logistic function.
Other
Desmos: Charge!
In this interactive application of linear modeling, students make a prediction about the length of time it would take to charge a smartphone. They then work through a series of steps where they sketch their prediction, extend a table of...
Math Graphs
Houghton Mifflin: Math Graphs: Fitting Models to Scatter Plots 1 [Pdf]
Students use a scatter plot to determine whether data can be modeled by a linear function, a quadratic function, a trigonometric function, or that there appears to be no relationship between x and y. The resource consists of an enlarged...
Math Graphs
Houghton Mifflin: Math Graphs: Fitting Models to Scatter Plots 2 [Pdf]
Students use a scatter plot to determine whether data can be modeled by a linear function, a quadratic function, a trigonometric function, or that there appears to be no relationship between x and y. The resource consists of an enlarged...
Math Graphs
Houghton Mifflin: Math Graphs: Fitting Models to Scatter Plots 3 [Pdf]
Students use a scatter plot to determine whether data can be modeled by a linear function, a quadratic function, a trigonometric function, or that there appears to be no relationship between x and y. The resource consists of an enlarged...
Math Graphs
Houghton Mifflin: Math Graphs: Fitting Models to Scatter Plots 4 [Pdf]
Students use a scatter plot to determine whether data can be modeled by a linear function, a quadratic function, a trigonometric function, or that there appears to be no relationship between x and y. The resource consists of an enlarged...
Stefan Warner and Steven R. Costenoble
Finite Mathematics & Applied Calculus: Quiz: Functions and Linear Models
The online quiz assesses student comprehension of math concepts. The quiz consists of true/false questions about functions and linear models.
Texas Instruments
Texas Instruments: Exponential Models and Logarithmic Scales
In this activity, students will analyze exponential growth data and then switch to a logarithmic scale. Includes both an exponential and a linear regression on the data, and asks students to make connections between two forms of...
Illustrative Mathematics
Illustrative Mathematics: S Id, F if Laptop Battery Charge
This task uses a situation that is familiar to students to solve a problem they probably have all encountered before: How long will it take until an electronic device has a fully charged battery? Given data, students perform a variety of...
Texas Instruments
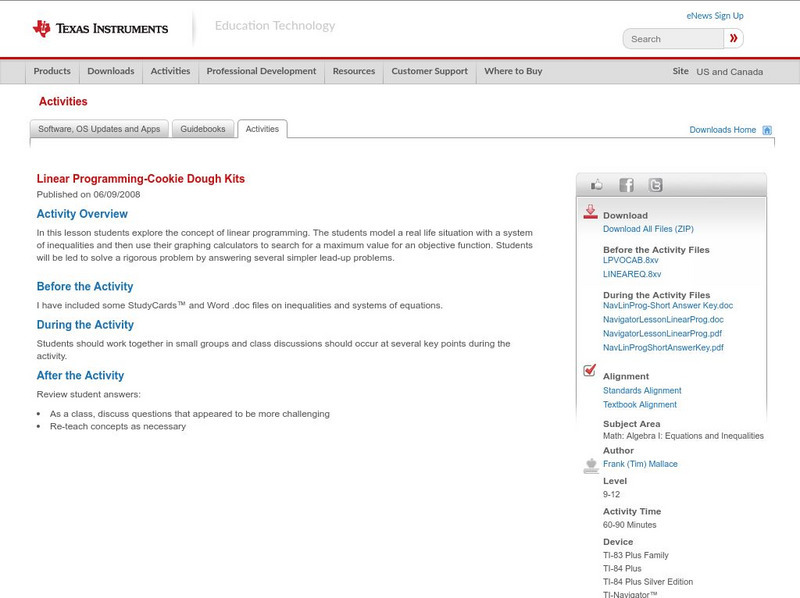
Texas Instruments: Linear Programming Cookie Dough Kits
In this lesson students explore the concept of linear programming. The students model a real life situation with a system of inequalities and then use their graphing calculators to search for a maximum value for an objective function....
Texas Instruments
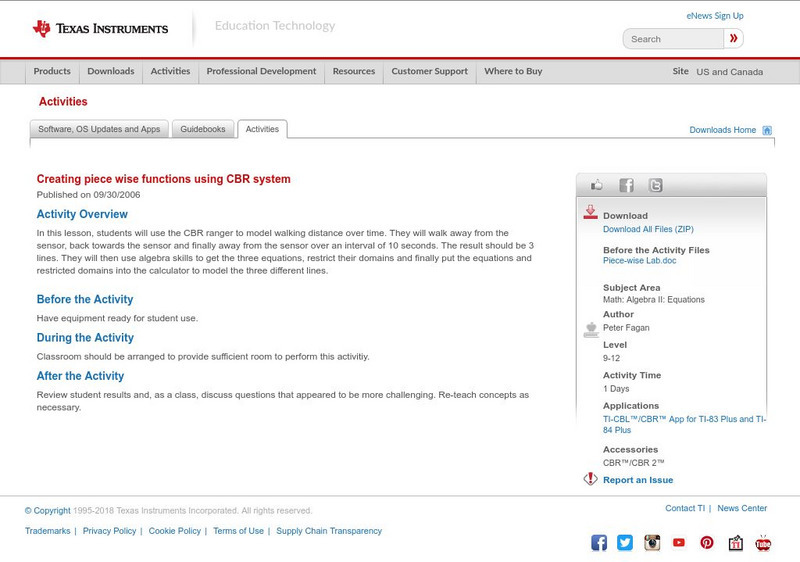
Texas Instruments: Creating Piece Wise Functions Using Cbr System
In this lesson, students can use the CBR ranger to model walking distance over time. They will walk away from the sensor, back towards the sensor and finally away from the sensor over an interval of 10 seconds. The result should be 3...
Student Achievement Partners
Student Achievement Partners: Penny Circle Task [Pdf]
Students will explpre models and understand the difference between quadratic, exponential, and linear models in this lesson.
TeachEngineering
Teach Engineering: Latex Tubing and Hybrid Vehicles
This unit gives students the opportunity to make use of linear models in order to make predictions based on real-world data. Students experience how engineers address incredible and important design challenges through the use of linear...
Texas Instruments
Texas Instruments: Math Today for Ti Navigator System Humidity Makes Air Feel
Using data from the USA TODAY graphic "Humidity makes air feel hotter" students will explore linear functions to determine how well they model the relationship between air temperature and heat index. When the model has been determined...
Other
Resources for Implementation: Golf Balls in Water
A lesson in which students model linear data with a linear function to solve a real-world problem.
Khan Academy
Khan Academy: Fitting Quadratic and Exponential Functions to Scatter Plots
Determine if a quadratic or exponential model fits a data set better, then use the model to make a prediction. Students receive immediate feedback and have the opportunity to try questions repeatedly, watch a video or receive hints.
Illustrative Mathematics
Illustrative Mathematics: 8.f Distance Across the Channel
This task asks students to find a linear function that models the relationship between water depth and distance across a channel at water level. After finding the equation, they have to verbalize the meaning of the slope and intercept of...
CK-12 Foundation
Ck 12: Analysis: Logarithmic Functions
[Free Registration/Login may be required to access all resource tools.] Evaluating logarithmic functions by comparing to exponential functions and rewriting to solve.
Texas Instruments
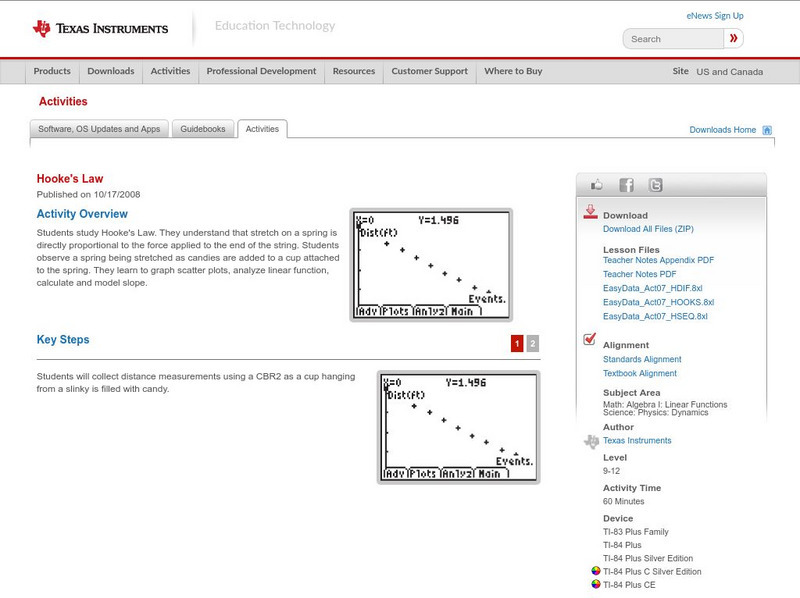
Texas Instruments: Hooke's Law
In this activity, students study Hooke's Law. They understand that stretch on a spring is directly proportional to the force applied to the end of the string. Students observe a spring being stretched as candies are added to a cup...
Texas Instruments
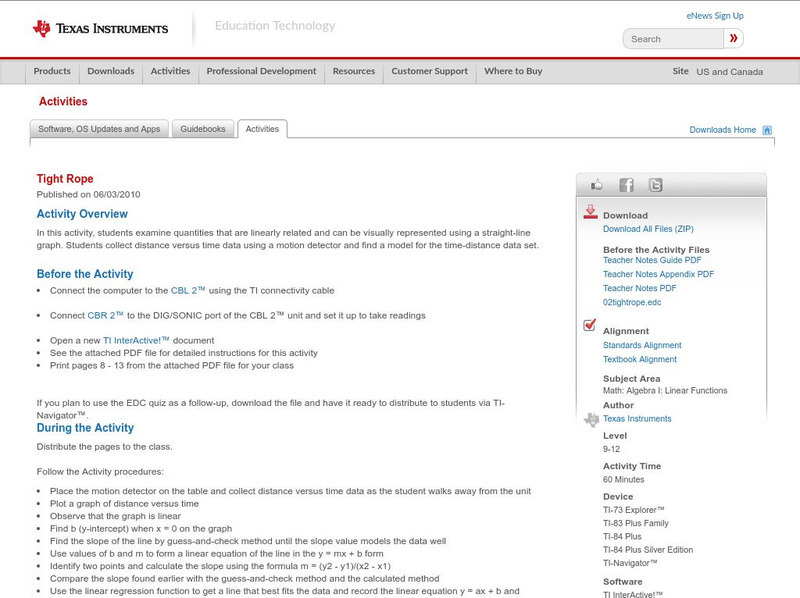
Texas Instruments: Tight Rope
In this activity, students examine quantities that are linearly related and can be visually represented using a straight-line graph. Students collect distance versus time data using a motion detector and find a model for the...
Texas Instruments
Texas Instruments: Getting Started With the Ti Navigator: If the Line Fits
This lesson introduces students to Activity Center and introduces students to the use of symbolic algebra to represent real world situations. They will use Activity Center to contribute equations that model a linear relationship and then...
Texas Instruments
Texas Instruments: Warming Up to Heating Curves
In this activity, students use the CBL 2 to collect temperature data as a sensor warms up in a cup of water. They find an appropriate mathematical model for the resulting data set.
Richland Community College
Richland Community College: Math 116 Lecture Notes
This site from the Richland Community College provides the detailed lecture notes to a college algebra course, complete with equations and definitions. Content ranges from "functions and their graphs" to "conics and parametric equations."
Math Graphs
Houghton Mifflin: Math Graphs: Fitting Models to Scatter Plots 7 [Pdf]
Learners use a given scatter plot to identify whether the data can be modeled by a linear, quadratic, or trigonometric function. The math graph is available in PDF format.


