Texas Education Agency
Texas Gateway: Making Predictions and Critical Judgments (Table/verbal)
Given verbal descriptions and tables that represent problem situations, the student will make predictions for real-world problems.
Texas Education Agency
Texas Gateway: Determining Slopes From Equations, Graphs, and Tables
Given algebraic, tabular, and graphical representations of linear functions, the student will determine the slope of the relationship from each of the representations.
Khan Academy
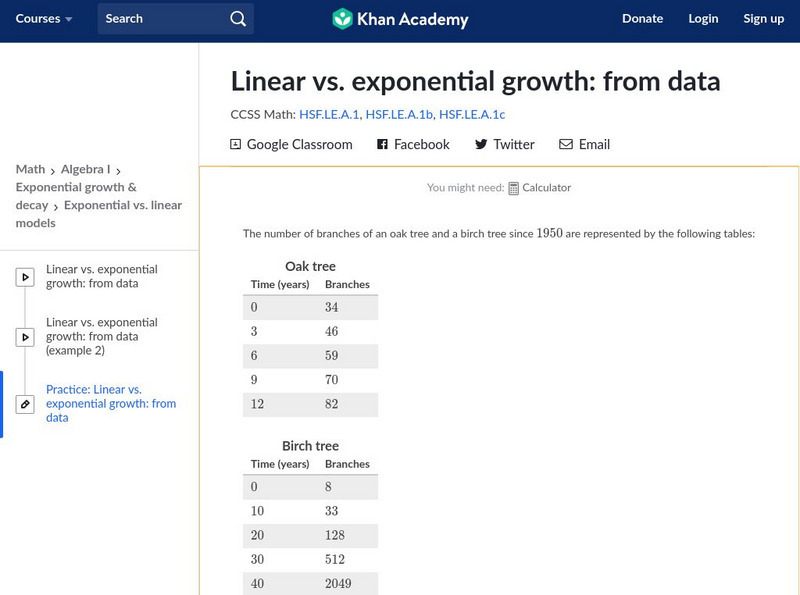
Khan Academy: Algebra I: Linear vs. Exponential Growth: From Data
Given a table with values of two quantities over time, determine whether the quantities grow linearly or exponentially. Students receive immediate feedback and have the opportunity to try questions repeatedly, watch a video or receive...
Illustrative Mathematics
Illustrative Mathematics: F Le in the Billions and Linear Modeling
In this task, students are shown a table of world population data and asked to explore whether linear functions would be appropriate to model relationships within the data. Aligns with F-LE.A.1.b.
CK-12 Foundation
Ck 12: Algebra: Graphs of Linear Equations
[Free Registration/Login may be required to access all resource tools.] Students learn to use a table to graph functions recognizing linear equations and the equations of horizontal lines and vertical lines. Students examine guided...
CK-12 Foundation
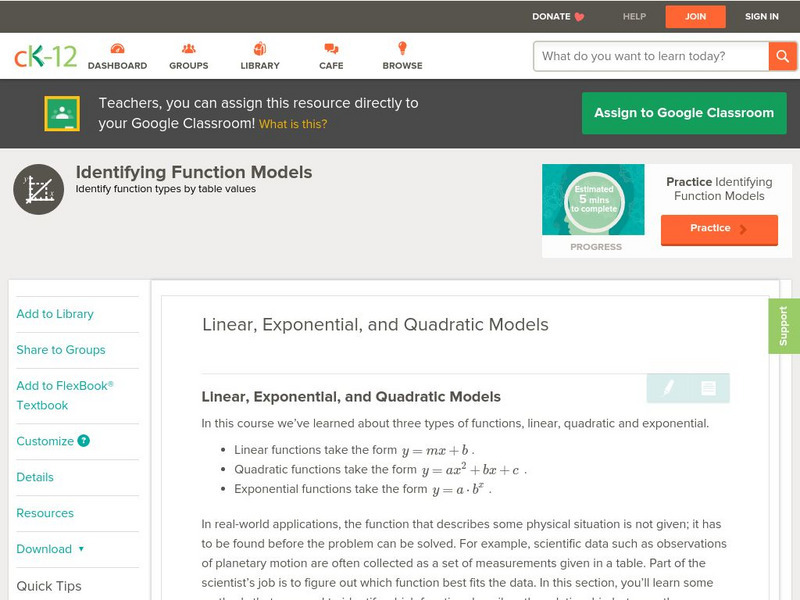
Ck 12: Algebra: Linear, Exponential, and Quadratic Models
[Free Registration/Login may be required to access all resource tools.] Given a table of values, determine the type of function being modeled.
CK-12 Foundation
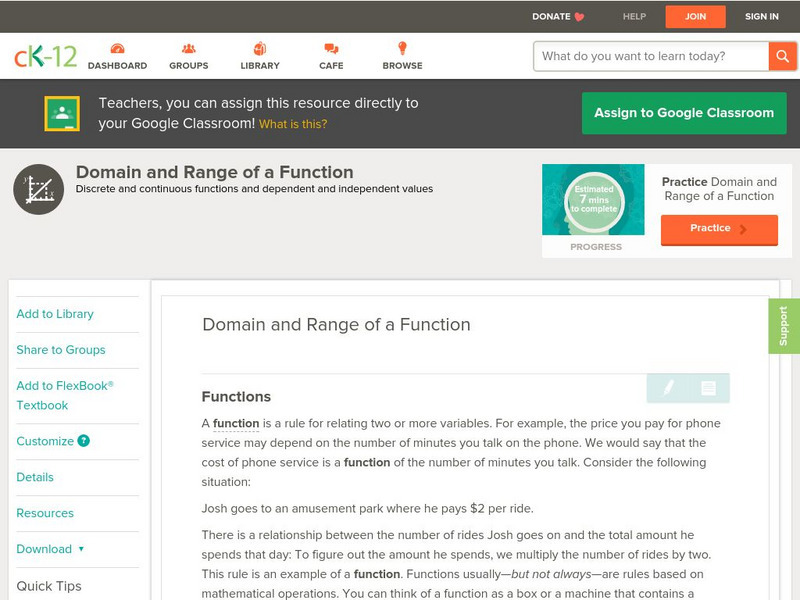
Ck 12: Algebra: Domain and Range of a Function
[Free Registration/Login may be required to access all resource tools.] Find the domain and range of a function and make a table of values for a function.
Illustrative Mathematics
Illustrative Mathematics: F Le Sandia Aerial Tram
For this task, students examine data on the elevation and the minutes into a ride for a tram that is traveling up a mountain and write an equation for the function that models the relationship between the two variables. Aligns with...
