Texas Education Agency
Texas Gateway: Determining Slopes From Equations, Graphs, and Tables
Given algebraic, tabular, and graphical representations of linear functions, the student will determine the slope of the relationship from each of the representations.
Common Core Sheets
Common Core Sheets: Functions 8.f.3 Worksheets
Print or create worksheets to assess students' understanding of linear functions.
Khan Academy
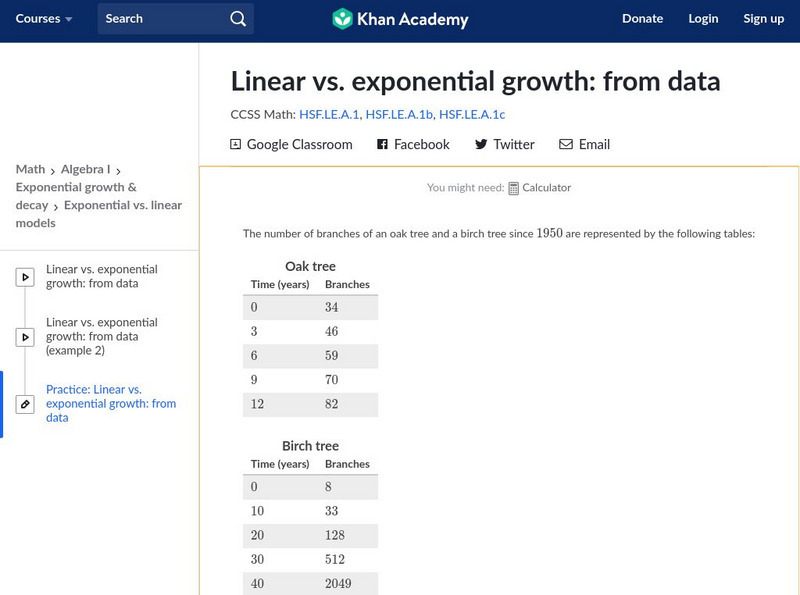
Khan Academy: Algebra I: Linear vs. Exponential Growth: From Data
Given a table with values of two quantities over time, determine whether the quantities grow linearly or exponentially. Students receive immediate feedback and have the opportunity to try questions repeatedly, watch a video or receive...
CK-12 Foundation
Ck 12: Algebra: Graphs of Linear Equations
[Free Registration/Login may be required to access all resource tools.] Students learn how to graph linear equations. Students examine guided notes, review guided practice, watch instructional videos and attempt practice problems.
CK-12 Foundation
Ck 12: Algebra: Using Functions to Describe a Situation
[Free Registration/Login may be required to access all resource tools.] Students learn to write a function rule from a table of values and represent real-world situations with a function. Students examine guided notes, review guided...
Illustrative Mathematics
Illustrative Mathematics: F Le in the Billions and Linear Modeling
In this task, students are shown a table of world population data and asked to explore whether linear functions would be appropriate to model relationships within the data. Aligns with F-LE.A.1.b.
CK-12 Foundation
Ck 12: Algebra: Graphs of Linear Equations
[Free Registration/Login may be required to access all resource tools.] Students learn to use a table to graph functions recognizing linear equations and the equations of horizontal lines and vertical lines. Students examine guided...
Texas Instruments
Texas Instruments: Where Should They Hold the Fundraising Party?
Students learn how to create a table of values for a simple linear function and use the table to create a graph on squared paper. They use the graphing calculator to display the ordered pairs and find values of corresponding to values of...
Texas Instruments
Texas Instruments: C Ds Anyone?
In this activity, students write rules for real world functions. They make a table to compare function values and graph linear functions on the coordinate plane.
Khan Academy
Khan Academy: Intercepts From a Table
Find the intercepts of a line given a table of values. Students receive immediate feedback and have the opportunity to try questions repeatedly, watch a video, or receive hints.
CK-12 Foundation
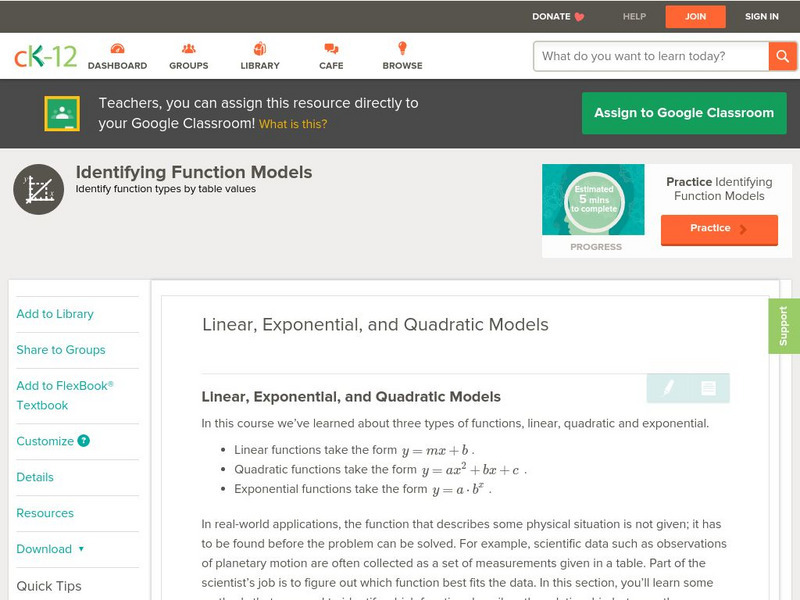
Ck 12: Algebra: Linear, Exponential, and Quadratic Models
[Free Registration/Login may be required to access all resource tools.] Given a table of values, determine the type of function being modeled.
CK-12 Foundation
Ck 12: Algebra: Function Rules for Input Output Tables
[Free Registration/Login may be required to access all resource tools.] Students learn to write a function rule from an input-output table. Students examine guided notes, review guided practice, watch instructional videos and attempt...
CK-12 Foundation
Ck 12: Algebra: Function Rules for Input Output Tables
[Free Registration/Login may be required to access all resource tools.] Students learn to write function rules from the input/output tables. Students examine guided notes, review guided practice, watch instructional videos and attempt...
Texas Instruments
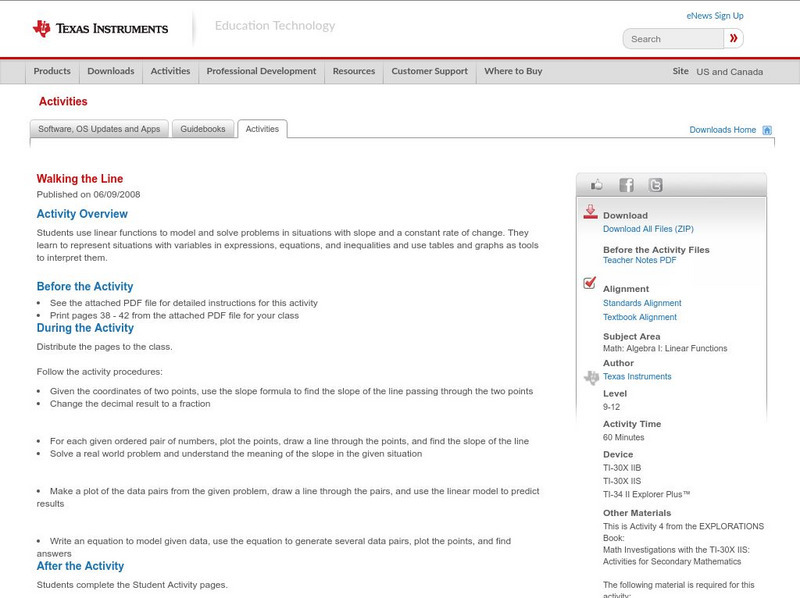
Texas Instruments: Walking the Line
In this activity, students use linear functions to model and solve problems in situations with slope and a constant rate of change. They learn to represent situations with variables in expressions, equations, and inequalities and use...
Illustrative Mathematics
Illustrative Mathematics: F Le Us Population 1982 1988
For this task, students are shown a table of U.S. population data between 1982 and 1988 and are asked to explore whether linear functions would be appropriate to model relationships within the data. Aligns with F-LE.B.5 and F-LE.A.1.b.
Alabama Learning Exchange
Alex: Math Is Functional
This lesson is a technology-based activity in which students extend graphing of linear functions to the use of spreadsheet software. After students have become proficient in constructing a table of values, students are able to...
CK-12 Foundation
Ck 12: Algebra: Function Rules for Input Output Tables
[Free Registration/Login may be required to access all resource tools.] Students learn to evaluate a given function rule for an input-output table. Students examine guided notes, review guided practice, watch instructional videos and...
Mangahigh
Mangahigh: Algebra: Draw Straight Lines Using Alternative Linear Formats
This interactive media source has two parts a learning mode and a practice game mode. The learning mode is where students are guided through understanding concepts of linear functions. Next, students play a game where they are asked...
Texas Education Agency
Texas Gateway: Direct Variation and Proportional Change
The student will use a variety of methods inculding tables, equations and graphs to find the constant of variation and missing values when given a relationship that varies directly.
CK-12 Foundation
Ck 12: Algebra: Input Output Tables for Function Rules
[Free Registration/Login may be required to access all resource tools.] Evaluate a given function rule using an input-output table
CK-12 Foundation
Ck 12: Algebra: Input Output Tables
[Free Registration/Login may be required to access all resource tools.] Students will understand functions by writing expressions for input-output tables. Students watch videos, examine guided notes, review vocabulary and attempt...
CK-12 Foundation
Ck 12: Algebra: Input Output Tables for Function Rules
[Free Registration/Login may be required to access all resource tools.] Evaluate a function rule by finding outputs for a given input
CK-12 Foundation
Ck 12: Algebra: Domain and Range of a Function
[Free Registration/Login may be required to access all resource tools.] Find the domain and range of a function and make a table of values for a function.
Illustrative Mathematics
Illustrative Mathematics: F Le Boiling Water
Students are shown two tables of data showing the approximate boiling point of water at different elevations. Both data sets can be modeled by linear functions but with different slopes. When the tables are combined, however, students...


