Khan Academy
Khan Academy: Practice: Recognize Functions From Tables
A practice question to test students knowledge of function.
Texas Instruments
Texas Instruments: Number Patterns and Functions: Rules, Tables
Number patterns can be made with any of the operations or combination of operations. Range and domain of any function can be listed in a table. When these functions are linear, the equation can be written in slope intercept form.
Illustrative Mathematics
Illustrative Mathematics: F Le Identifying Functions
In this task, students are shown a table with linear, quadratic, and exponential functions at various values of x and are asked to match the function type to each data set and explain their reasoning. Aligns with F-LE.A.1.b and F-LE.A.1.c.
Illustrative Mathematics
Illustrative Mathematics: F Le Sandia Aerial Tram
For this task, students examine data on the elevation and the minutes into a ride for a tram that is traveling up a mountain and write an equation for the function that models the relationship between the two variables. Aligns with...
Other
Desmos: Charge!
In this interactive application of linear modeling, students make a prediction about the length of time it would take to charge a smartphone. They then work through a series of steps where they sketch their prediction, extend a table of...
Khan Academy
Khan: Lsn 8: Interpreting Relationships in Scatterplots/graphs/tables/equations
This lesson focuses on Interpreting and analyzing linear, quadratic, and exponential models and graphs. Students will use best fit lines to interpret contexts, distinguish whether contexts are linear or exponential functions, use the...
Texas Instruments
Texas Instruments: Getting Started With the Ti Navigator System: River of Life
This lesson introduces students to Activity Center and is intended to help students develop the conceptual understanding of how to identify functions as linear or nonlinear and contrast their properties from tables, graphs, or equations.
CK-12 Foundation
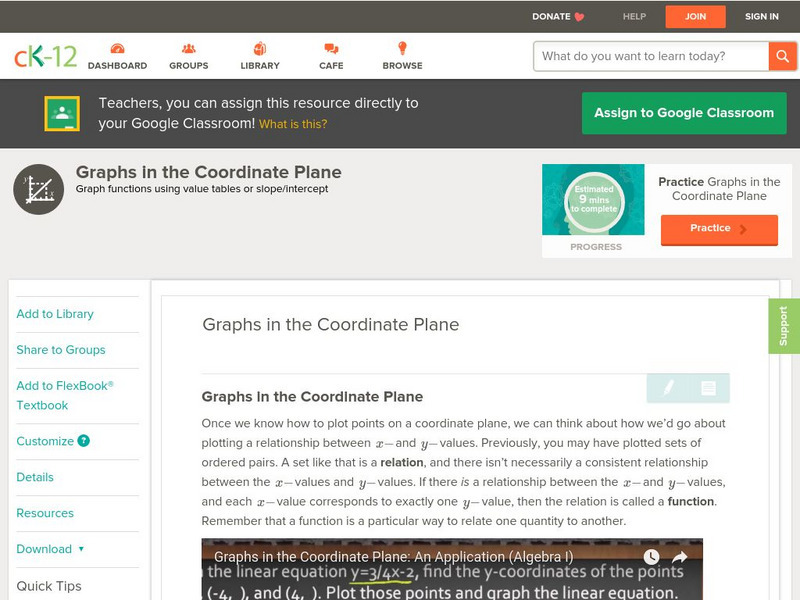
Ck 12: Algebra: Graphs in the Coordinate Plane
[Free Registration/Login may be required to access all resource tools.] Students learn to use tables of values and rules to graph functions. Students examine guided notes, review guided practice, watch instructional videos and attempt...
Mangahigh
Mangahigh: Algebra: Recognize Common Straight Line Graphs
Mangahigh is a website with math games aimed at twelve to eighteen year olds. On this site students draw and recognize lines without the need to construct a table of values.
Khan Academy
Khan Academy: Rates and Proportional Relationships
A variety of questions about rates and proportional relationships involving graphs, tables, and equations. Students receive immediate feedback and have the opportunity to try questions repeatedly, watch a video, or receive hints.
Illustrative Mathematics
Illustrative Mathematics: 8.f Us Garbage, Version 1
Eighth graders work with input values (the year) and output values (the amount of garbage that year) in a table about the garbage produced in the US. They study the table to answer specific questions, state whether it represents a linear...
Texas Instruments
Texas Instruments: Getting Started With the Ti Navigator: Quadratic Equations
This lesson introduces students to Activity Center and is intended to help students write systems of equations in standard form in slope intercept form to solve the system using tables and graphs.
Ministry of Education and Universities of the Region of Murcia (Spain)
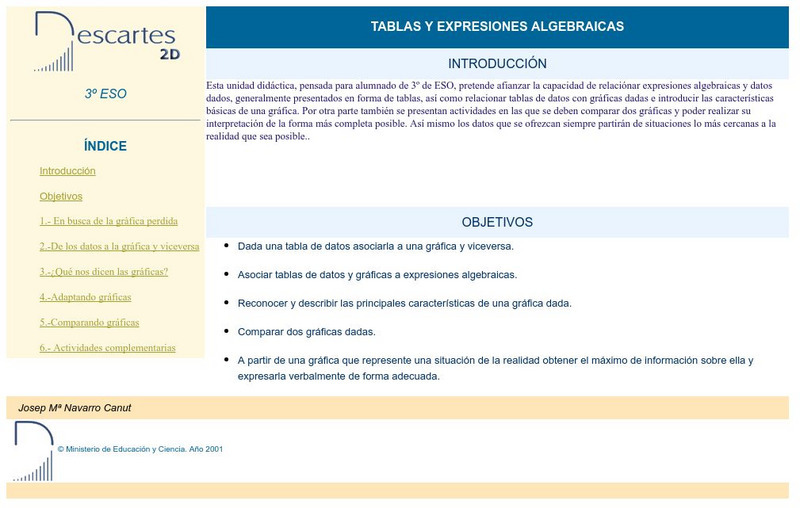
Ministerio De Educacion Y Ciencia: Tablas Y Expresiones Algebraicas
In Spanish. Interactive activities associating data tables with their algebraic graph
Other
Nearpod: What Is Slope?
In this lesson on slope, students explore how the rate of change can be identified using a graph, a set of points, and a table.
Math2
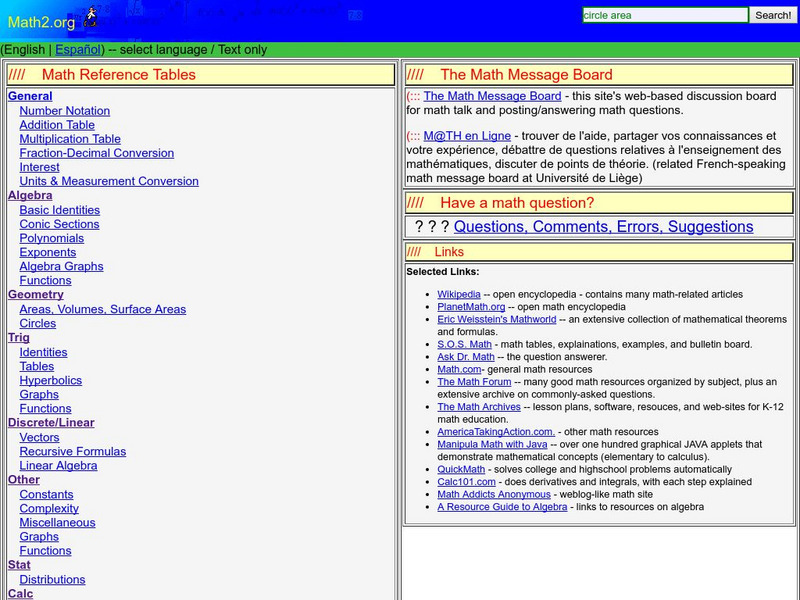
Math2
This is a site for students and teachers of all grade levels. If you are looking for math tables, general information about math topics, or you would like to ask a question, this is the site to visit.
Illustrative Mathematics
Illustrative Mathematics: F Le Basketball Bounces, Assessment Variation 1
This task asks students to analyze a set of data about the height of a basketball for each time it bounces. They choose a model that reasonably fits the data and use the model to answer questions about the physical context. This variant...
Illustrative Mathematics
Illustrative Mathematics: F Le Basketball Bounces, Assessment Variation 2
This task asks students to analyze a set of data about the height of a basketball for each time it bounces. They choose a model that reasonably fits the data and use the model to answer questions about the physical context. This second...
ClassFlow
Class Flow: Graphing Inequalities
[Free Registration/Login Required] Students represent functional relationships using tables, equations, and graphs, and describe the connection among these representations.
Illustrative Mathematics
Illustrative Mathematics: F Le Choosing an Appropriate Growth Model
The goal of this task is to examine some population data for large cities from a modeling perspective. Young scholars are asked to decide if the population data can be accurately modeled by a linear, quadratic, and/or exponential...
Illustrative Mathematics
Illustrative Mathematics: F if a Sse Modeling London's Population
In this task, students are shown a table of population data for the city of London and are asked to explore whether a linear, quadratic, or exponential function would be appropriate to model relationships within the data. They are next...
Texas Instruments
Texas Instruments: Social Security Issues
In this activity, you will look at the relationship between the age at which you start drawing social security and the amount drawn. Both graphs and spreadsheets will be used.
Texas Instruments
Texas Instruments: Math Today Challenge New Color of Money
In this activity, students will read about the changes in the "new money" and then create a graph to represent various combinations of currency produced. This activity provides an excellent example of discrete, real-world data.
Sophia Learning
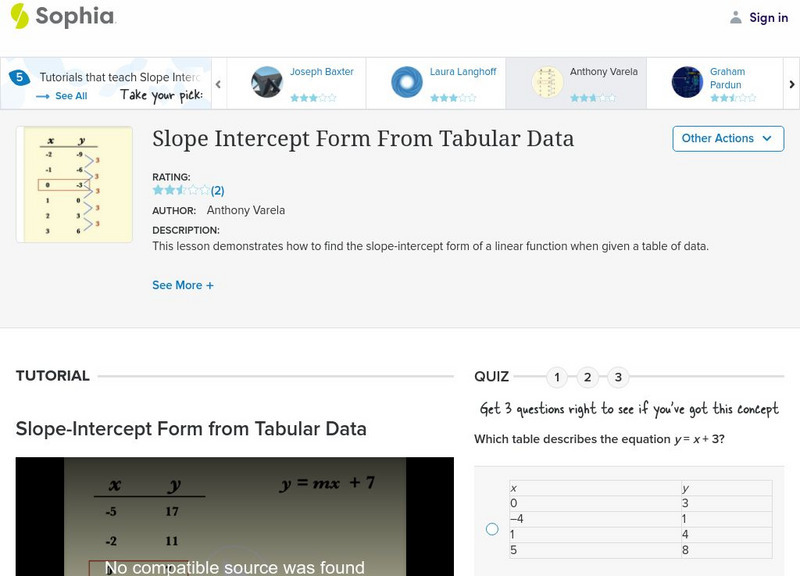
Sophia: Slope Intercept Form From Tabular Data: Lesson 2
This lesson demonstrates how to find the slope-intercept form of a linear function when given a table of data. It is 2 of 4 in the series titled "Slope Intercept Form From Tabular Data."
Sophia Learning
Sophia: Slope Intercept Form From Tabular Data: Lesson 3
This lesson demonstrates how to find the slope-intercept form of a linear function when given a table of data. It is 3 of 4 in the series titled "Slope Intercept Form From Tabular Data."

