Curated OER
Graphing and Analyzing
In this graphing and analyzing worksheet, 9th graders first state if each graph represents a linear or nonlinear relationship. Second, they create a difference table for each set of data presented and determine whether it represents a...
Curated OER
Twenty-Seven Graphing Lines, Parabolas, and Absolute Value Problems
Have learners find coordinates of point on a graph, find equations of graphs given, and graph given equations using in and out tables. There are 27 problems related to equations for lines, parabolas, and absolute value functions.
Curated OER
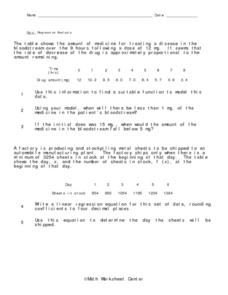
Regression Analysis
In this regression analysis worksheet, 9th graders solve 10 different word problems related to regression analysis. First, they use the information given to find a suitable function to model the data. Then, students use the model to...
Albert Shanker Institute
Economic Causes of the March on Washington
Money can't buy happiness, but it can put food on the table and pay the bills. The first of a five-lesson unit teaches pupils about the unemployment rate in 1963 and its relationship with the March on Washington. They learn how to create...
Curated OER
Metric Meals
Sixth graders investigate metric measurements. In this metric measurement lesson, 6th graders explore mass, capacity, and length. Students examine graduated cylinders and balance scales to obtain measurements. Resources are provided.
Curated OER
Confusing Colors!
Fourth graders collect data, graph their data, and then make predictions based upon their findings. They's interest is maintained by the interesting way the data is collected. The data collection experiment is from the psychology work of...


