Wyzant
Wyzant: Graphing Linear Equations Using Slope Intercept Form
Students practice graphing linear equations using slope-intercept form. The resource consists of an example, practice exercises, and solutions.
Curated OER
Linear Functions
This site contains a short tutorial on point-slope, slope-intercept, and general form of linear equations. The site has an interactive graph of lines showing how the graph of a line changes when values of the linear equation change.
Texas Instruments
Texas Instruments: Explore Graphs and Factors
Students use a graphing calculator to explore the relationship between the linear factors of a quadratic function and its zeros. They learn that the x-intercepts and axis of symmetry of a quadratic function can be determined from its...
University of Regina (Canada)
University of Regina: Math Central: Introduction to Slope for Middle Years Mathematics
This collection of five middle school math lessons covers the topic of plane geometry, specifically the concept of slope. The first lesson introduces middle schoolers to plotting points on a Cartesian grid using a Geoboard. Lesson two...
Khan Academy
Khan Academy: Algebra I: Point Slope Form
Write equations in point-slope form given two pairs of values, and convert the equation into slope-intercept form. Students receive immediate feedback and have the opportunity to try questions repeatedly, watch a video or receive hints.
ClassFlow
Class Flow: Straight Lines
[Free Registration/Login Required] Students explore straight lines, graphing lines and applying the formula for graphing linear equations.
Other
Interactive Algebra: Graphing Helper for (Y = Mx + B)
Enter the slope and y-intercept of any line and it will be graphed for you. This site is great for becoming familiar with the concept of graphing and for checking your own graphs. Requires Java.
ClassFlow
Class Flow: Definition of Slope
[Free Registration/Login Required] Presents the definition of slope and the formulas for y-intercept form.
Khan Academy
Khan Academy: Slope From a Graph
In this exercise, students practice constructing a linear equation for a line graph in order to find the slope. Students receive immediate feedback and have the opportunity to watch a video, get hints, or try questions repeatedly.
University of South Florida
Fcat: Spaghetti Bridges: Teacher Notes
Students build bridges and test their strength to collect data and write an equation. The concept of slope is explored in this activity.
Texas Education Agency
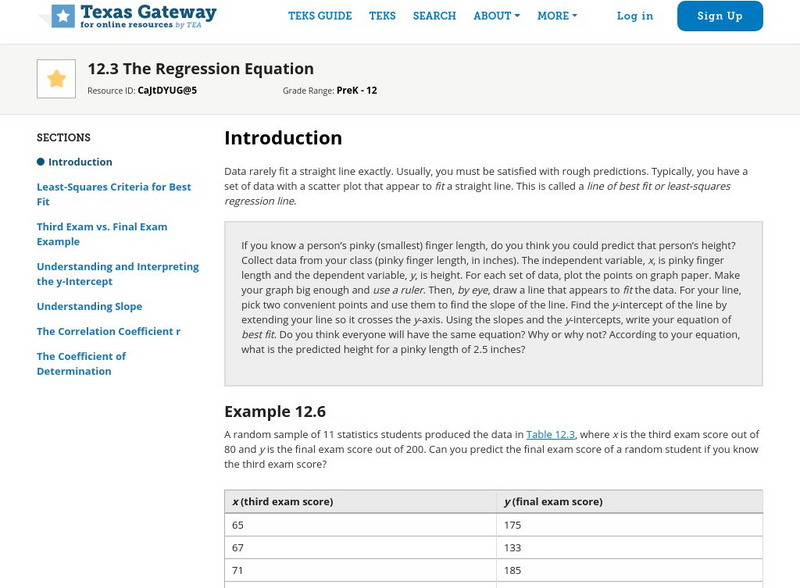
Texas Gateway: Tea Statistics: The Regression Equation
A tutorial on how to find the line of best fit or least-squares regression line for a set of data in a scatter plot using different methods and calculations.
Lawrence Hall of Science
The Math Page: Skill in Algebra: The Equation and Graph of a Straight Line
Here is a site that clearly and thoroughly explains the equation of a line, including how to find points on a line, intercepts, and how to recognize the equation of a line. There are example problems solved, problems for the student to...
Illustrative Mathematics
Illustrative Mathematics: S Id.6a,7 Olympic Men's 100 Meter Dash
This task asks students to identify when two quantitative variables show evidence of a linear association and to describe the strength and direction of that association. Students will use a scatterplot showing the finishing times for the...
Sophia Learning
Sophia: Line of Best Fit
Sophia: Line of Best Fit is a resource students will be exposed to different learning supports that will enhance concepts such as Best-fit line and regression, interpreting intercept and slop, least-squares line, linear equation,...
Illustrative Mathematics
Illustrative Mathematics: S Id.7 Used Subaru Foresters
Jane wants to sell her Subaru Forester and does research online to find other cars for sale in her area. She examines the scatterplot of price versus age and determines that a linear model is appropriate. Answer a variety of questions...
Illustrative Mathematics
Illustrative Mathematics: 8.f Downhill
In this task, a car is traveling down a steep hill. Students are given the function for elevation versus distance from the start and are asked to find and explain the slope and intercepts of the graph. Aligns with 8.F.B.4.
Texas Instruments
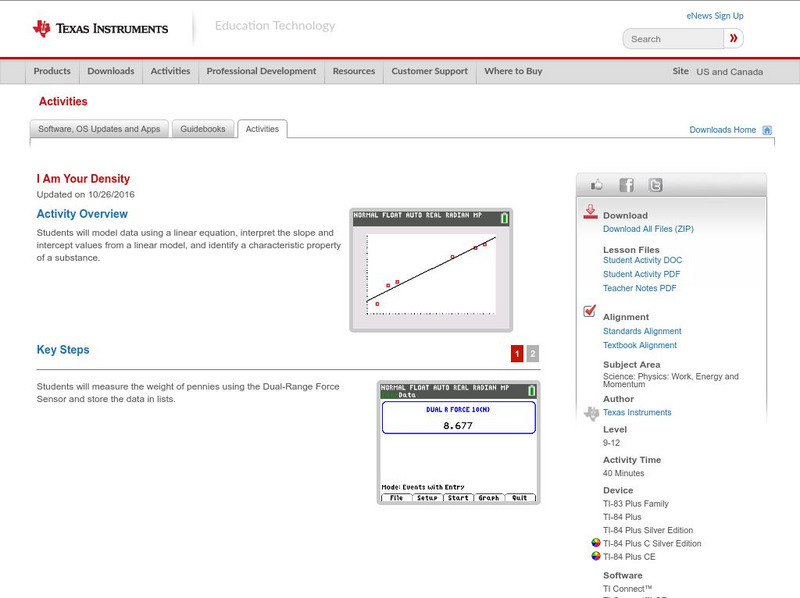
Texas Instruments: I Am Your Density
In this activity you will: Model data using a linear equation; interpret the slope and intercept values from a linear model; identify a characteristic property of a substance; and examine the relationship between mass, volume, and density.
University of Regina (Canada)
University of Regina: Math Central: Characteristics of a Line
Characteristics of a line are explained to students through four different lessons. Topics include intercepts, slope, and special line cases. The lessons have an overview, materials, procedures, and evaluation techniques.
Texas Instruments
Texas Instruments: Cabri Jr. The Equation of a L Ine
This activity uses Cabri Jr. to graph a line and show the equation of the line. The equations for oblique, horizontal and vertical lines are explored with emphasis on slope and y-intercept.
Texas Instruments
Texas Instruments: Coordinate Geometry the Equation of a Line
This activity teaches students the relationship between the slope, y-intercept, and the equation of a line.
Texas Instruments
Texas Instruments: Activity Center Golf Course
There are nine activity settings. Each one is a different hole of golf. Each setting contains a background photograph of a golf course with a white ball and a hole with a numbered flag coming out of it. Students must submit the equation...
Texas Instruments
Texas Instruments: Number Patterns and Functions: Rules, Tables
Number patterns can be made with any of the operations or combination of operations. Range and domain of any function can be listed in a table. When these functions are linear, the equation can be written in slope intercept form.
Illustrative Mathematics
Illustrative Mathematics: 8.f Distance Across the Channel
This task asks students to find a linear function that models the relationship between water depth and distance across a channel at water level. After finding the equation, they have to verbalize the meaning of the slope and intercept of...
Purple Math
Purplemath: Graphing Quadratic Functions: Introduction
The most basic quadratic is y = x2. The general technique for graphing quadratics is the same as for graphing linear equations. The quadratics graph as curvy lines (called "parabolas"), rather than the straight lines generated by linear...


